Most people love looking at implementation trends. For example, many of us pore over trends, such as how our favorite sports teams have done over the past ten games or how the stock market has performed this year. Those of us in the world of education analyze student success metrics (retention rates, etc.), institutional revenues, and other data over time, all intending to gain insight into whether things are improving or declining.
But does looking at trends this way provide the most meaning? Might we be missing other patterns that better illustrate these trends? In this piece, we will explore these questions using a technique called “time series clustering”, focusing specifically on implementations of technology related to teaching and learning.
Methodology
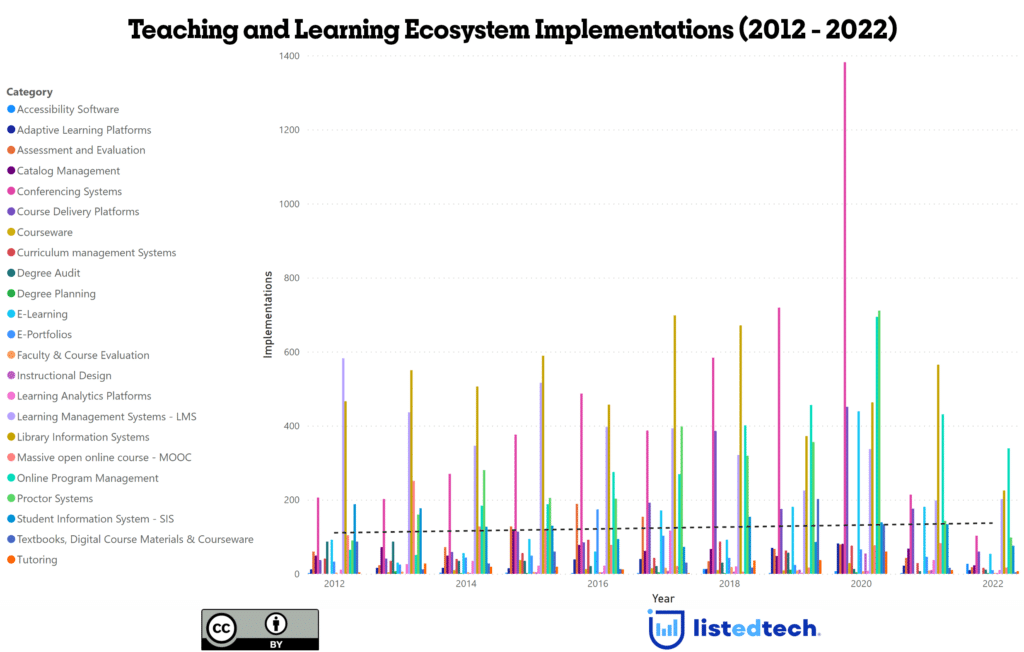
First, we should take a step back and understand our methodology. We began by selecting implementation data from 2012 to 2022 for the most closely related categories connected to teaching and learning, such as the learning management system, course delivery systems, conferencing systems, and proctor systems. As a result, our analysis covered eleven categories and just under 3,000 institutions across all institutional sectors (public, private, two-year, four-year, etc.) and enrollment sizes.
Figure 1 below shows the implementation trends for these categories. There are some clear takeaways from these trends, such as the spike in implementations of several categories during the pandemic. Likewise, we can note that the overall implementation trend is flat, with little growth or decline since 2012.
Yet the figure also shows how little we can say about anything else. Can we, for example, make any sense of the trends that have not shown an increase during the pandemic from this figure? Likewise, will this view of trends help us understand whether there is any relationship between the categories?
We decided to go deeper in our analysis and performed a time clustering analysis to answer these questions. This analysis, used in fields such as biology and finance, aims to extract information from complex data sets by organizing data points into groups based on their similarity. For example, scientists might want to understand how changes in thousands of genes over time relate to a specific human characteristic (stress, etc.). Likewise, a financial analyst may seek to uncover patterns in how stock prices have moved during the past year to predict better how these prices might move.
Findings
The output of our analysis revealed four clusters, as shown in Figure 2. We marked each cluster with a red line to show its underlying trend and normalized the implementation data to compare trends better. These clusters fall within four main sets of activities related to teaching and learning:
- Augmentation and Development: Comprising just over 6,200 implementations of solutions such as library management solutions and catalog management solutions, this is the smallest segment and details technologies (library information systems, for example) that enable institutions to support teaching and learning.
- Delivery and Content: This segment, consisting of nearly 10,000 implementations, is the largest and identifies the technologies institutional leaders leverage to deliver educational content, technologies that include assessment and evaluation solutions, conferencing systems, curriculum management solutions, and textbooks, digital course materials & courseware solutions.
- Support and Planning: This is the third largest segment, with just over 8,000 implementations. It consists of technologies (learning management systems and degree auditing solutions) that enable institutional leaders to support their students along their learning journeys.
- Design and Evaluation: Comprising nearly 6,700 implementations, this segment includes solutions (instructional design solutions and learning analytics platforms, for example) that empower institutional leaders to design courses and measure student success related to teaching and learning.
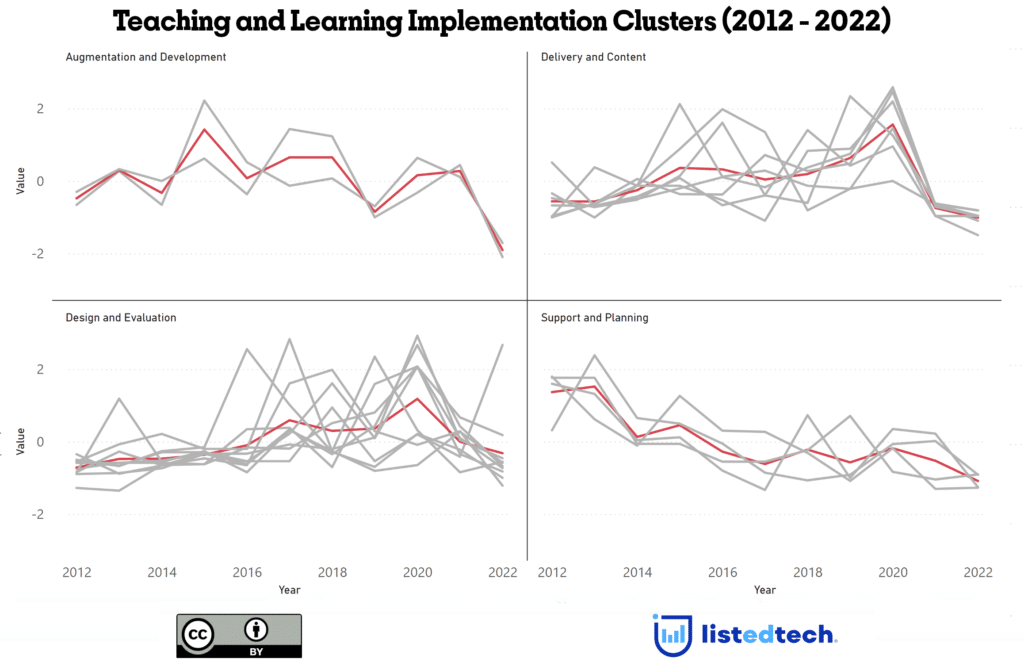
This analysis gives us more insight into the interrelationship between implementation trends. Rather than looking only at the upward or downward movement of a single category or overall, we now see segments showing similar implementation patterns over time. For example, it reveals that some groups of technologies are rising or falling together: implementation of solutions within the Design & Delivery and Design & Evaluation clusters has increased since 2012, while solutions in the other two clusters have decreased over the same period.
This approach also helps us become more efficient in our predictions as the longitudinal correlation of products guides us to consider whether and how institutions group products. As a result, when predicting a category’s future market share increase, like the learning management system, we might consider the consequent increase in the market share of another product in the same cluster, such as degree audit solutions.
Summary
Understanding implementation trends is valuable, as we can gain insight into the market movement and perhaps institutional priorities relating to technology. Yet viewing implementation clusters does provide additional insight that viewing trends overall or by category obfuscates, revealing patterns such as the spike in solutions supporting course delivery during the pandemic and unlikely ones (the decline in solutions related to support and delivery, for example).
In future research, we will continue refining this analysis to detail what drives clusters. For example, might other factors (enrollment trends, etc.) play a role in determining whether a cluster trends upwards or downwards? Likewise, is there a relationship between the clusters so that when one increases, another decreases, for example?
We look forward to presenting our findings and receiving feedback over the next few months.