ListedTech
  • Data Portals
    • Portal for Industry
    • Portal for Institutions
    • Webinars
  • Product Categories & Reports
  • Resources
    • Blog
    • Podcast
    • Documentation
    • Webinars
  • About Us
    • Our Story
    • Data Overview
    • Traditional IT Research vs. ListEdTech
    • In the Media
    • Contact Us

Search the website...

Go to Portal
Posted on August 8, 2021 | by Justin Ménard

A Glimpse Of The Institution Portal – Implementation Time

ListEdTech
Implementation Time LMS NA H Ed - LisTedTECH

Since August 2nd, we have given access to an early-release version of our institution portal to many institution representatives. This free-of-charge limited access shows the data we have on e-mail systems. When August 16th comes around, the portal will launch with 20 product categories.

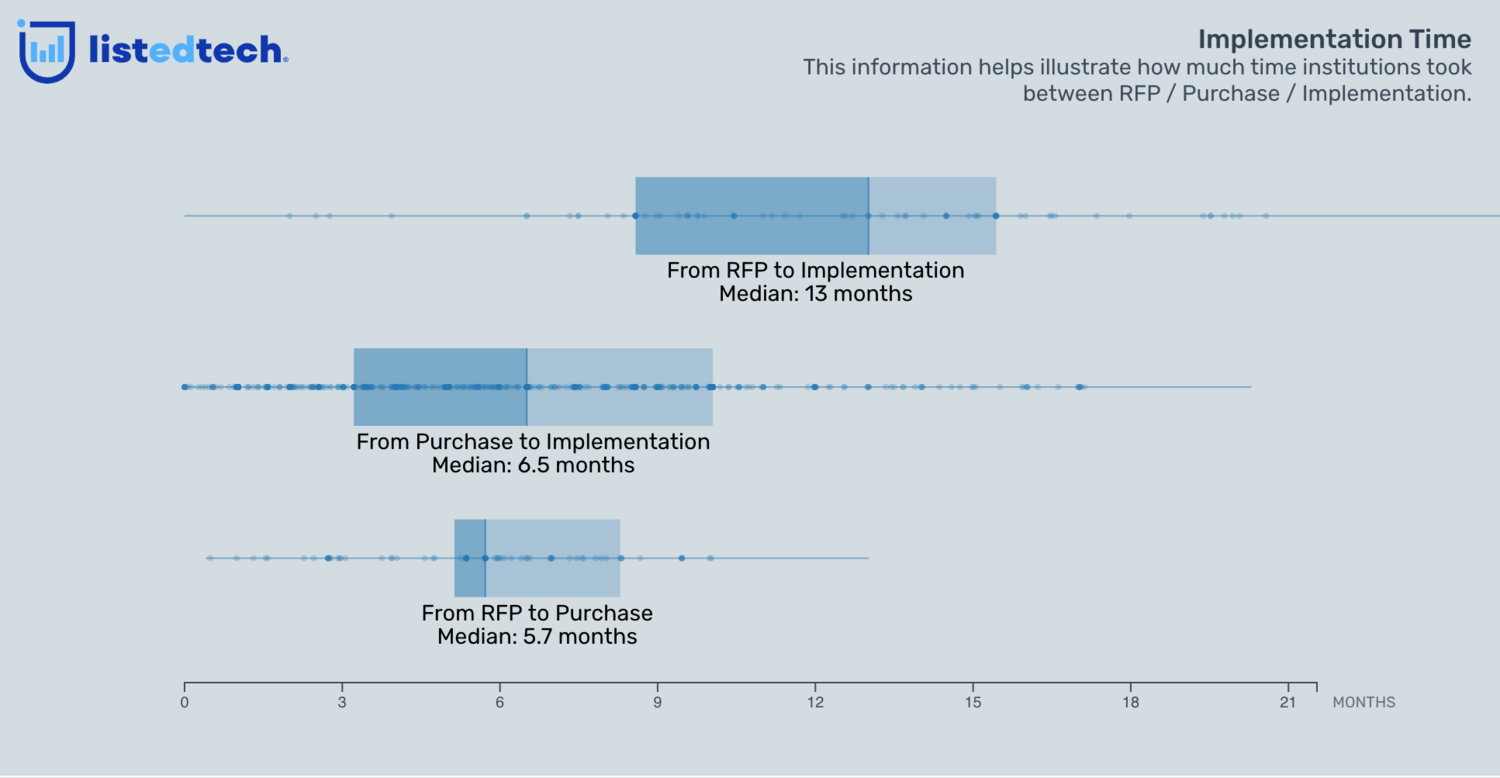
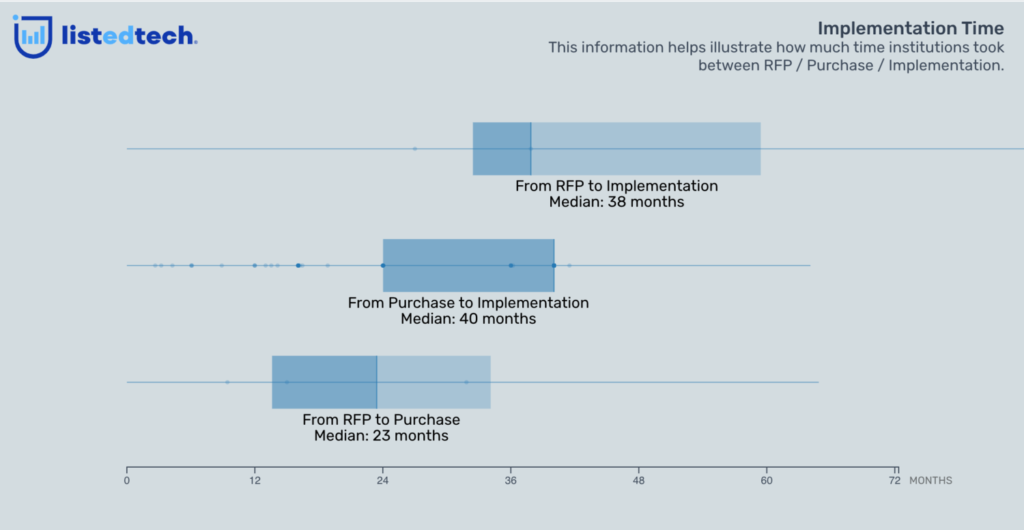
Today, we want to show you one of the graphs available on the portal when it is officially launched: the implementation time visualization. This graph helps illustrate how much time, on average, institutions took between the request for proposal step, the purchase of a solution and its implementation.

LMS Implementation Viz

In our Implementation Time visualizations, we break down the data into three graphs: from RFP to purchase, from purchase to implementation, and the overall from RFP to implementation. At a glance, we can see the median for all the steps.

K12 SIS Implementation Viz

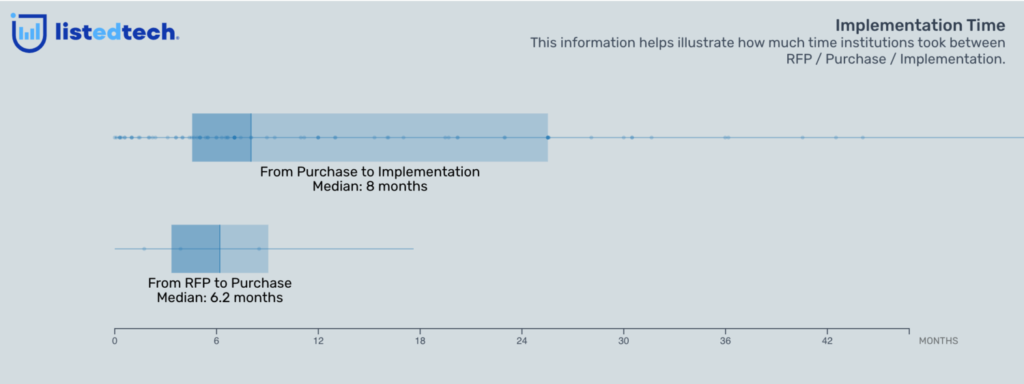
When we compare the LMS and the SIS implementation times, we notice that the SIS process takes much longer. Since this is a core component of the institution’s business structure, it is expected.

CRM Implementation Viz

We also wanted to show you a third product category. As you can see, we don’t show the RFP to Implementation timeline for the CRM solutions. The reason is that we don’t have enough data to show it. To represent an adequate reality, we set a minimum threshold of data for the portal.

Market Trends Filters

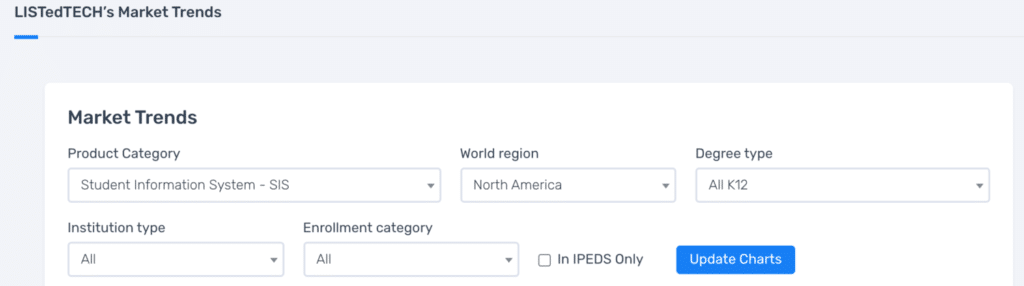
The implementation data graphs are part of the Trends section on the institution portal. When a user visits this page, they can decide to filter the several charts based on their own institutions filters: world region, degree type, institution type, and enrollment category. So, if you are a North American, public, 2-year college with a total enrollment of between 2,500 and 4,999, you will be able to see how much time similar institutions have taken for their implementation. We also propose a technology peer institution comparison, as mentioned in previous posts.

The institution portal proposes ten visualizations in the Trends section in addition to the lookup functionality, which searches in the database for specific institution data. All our graphs and data are updated each day. We hope you will give the institution portal a try. And if you already did, we thank you and ask you to share any feedback you may have.

Post navigation

An Update On Our Definition Of (Tech) Peer Institution
Our Institution Portal Is Now Live!
  • Subscribe to Our Newsletter
  • CAPTCHA image

    * All fields are required.

  • Listen to Our Podcast


  • Recent Posts

    • Who Are HigherEd’s Tech Leaders? October 15, 2025
    • Anthology’s Chapter 11 Filing: Breaking Up to Refocus October 1, 2025
    • Rethinking Market Saturation in EdTech September 24, 2025
    • Thesis: From Unit4 Spin‑Off to SIS Specialist September 17, 2025
    • How Institutions Discover What Tech Their Peers Are Using September 3, 2025

Stay in the know…

Blog & News
Higher Ed Market Data

Who Are HigherEd’s Tech Leaders?

This year, I’ve been revisiting some of the classic business books: Blue Ocean Shift, Free, The Innovator’s Dilemma, Zero to One, and of course, Crossing the Chasm. That last one really got me thinking about early adopters. In tech markets, they’re the people (or in HigherEd, the institutions) who are comfortable taking risks, trying something new, and shaping the market ... Who Are HigherEd’s Tech Leaders?  Read More
Market Data Market Movements

Anthology’s Chapter 11 Filing: Breaking Up to Refocus

September 2025 marked a major turning point for Anthology, the owner of Blackboard and several other higher education technology platforms. The company filed for Chapter 11 bankruptcy in the U.S. after efforts to sell itself or parts of its business outside of court failed. The filing is not a liquidation. Instead, it is a structured reorganization designed to ... Anthology’s Chapter 11 Filing: Breaking Up to Refocus  Read More
ListEdTech Market Data

Rethinking Market Saturation in EdTech

Market saturation is a concept we often discuss at ListEdTech because it comes up frequently with our clients. Investors want to know if a market still has room to grow, while startups want to understand whether they are entering a space with opportunities or one that is already crowded. Last year, we explored saturation by ... Rethinking Market Saturation in EdTech  Read More
Footer Logo - LisTedTECH
  • Contact Us
  • Frequently Asked Questions
  • Privacy Policy
  • Terms of Use