Guest blog post by (Joshua Perry)
This is part two in a series of two blogs written by Justin Menard and me (Joshua Perry) using each other’s datasets. His blog post last week examined customer migration in the UK. This blog will look at what the North American market can tell us about how markets evolve. But before I get stuck in, let me quickly explain who we are and what we’re up to.
I blog about UK Management Information Systems (MIS). Justin does the same for the US (where the same product is referred to as the School Information System, or SIS). That said, there are some key differences between us:
Justin has to work harder to collate his data because I just use stats released by the government following freedom of information requests, whereas Justin has to collate his using all kinds of clever techniques.
Justin also covers other products (like the LMS) and countries (so many countries), whereas I’m a one-trick, UK-focused MIS pony.
Justin has been far-sighted enough to turn his work into a thriving market insights company, called ListEdTech whereas I just… blog for fun?
Anyway, back to me. I’ve created a Tableau Story in the same house style I use to blog about the English market, but using Justin’s North American data source. As always, I’ll give you the interactive graphs first, then you’ll find my analysis below…
So what can we see?
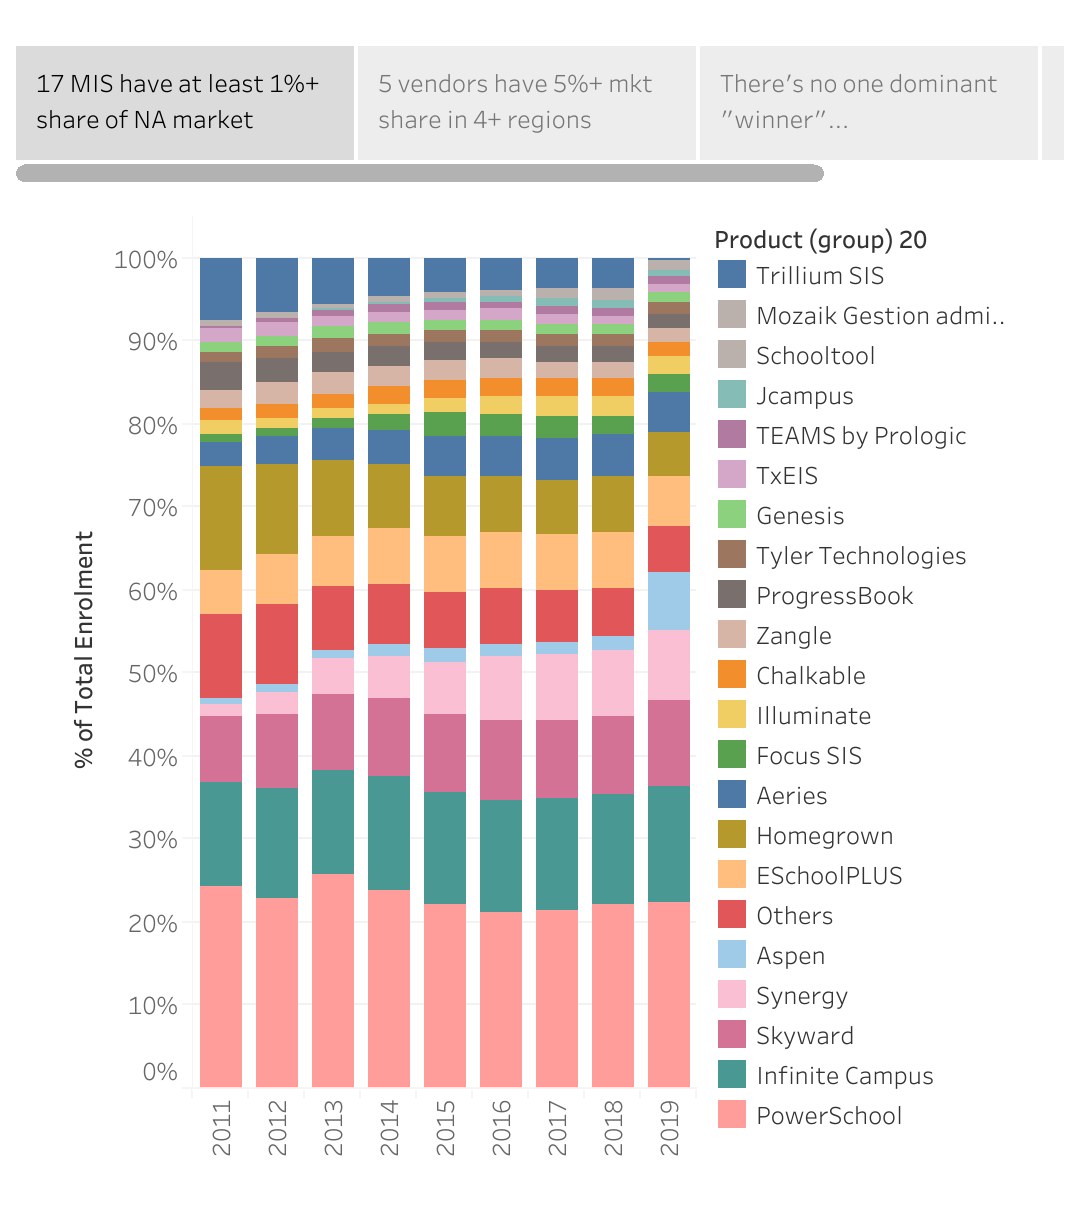
A mature market probably doesn’t include a single dominant vendor. In England, there’s a big beast called SIMS, owned by Capita, with 75% market share. That’s down from 84% in 2012, but still, you know, three quarters of a market is a lot. In North America, however, it’s a very different story. As the viz on the first tab above shows, no vendor has managed to claim more than around 25% of the North American market in any year (Powerschool had 25.8% in 2013). Now it’s true that North America is a more competitive market than the UK, with over 30 vendors boasting 100,000+ pupils within their districts, compared to just seven or eight vendors with that scale in England. But still: the trend in the past few years has been towards a more mature market, with greater competition for SIMS’s crown, and the North American data suggest that may well continue.
That said, there’s still space for local champions with majority market share. As my second viz shows, North America has notable variations at the regional level. This is particularly true in Canada, where no region has more than four meaningfully-sized vendors, but it’s also noteworthy that no more than seven or eight vendors compete in each of the three southern USA regions. We see similar patterns in the UK, where areas like Scotland and Northern Ireland basically procure a single system for the whole country. Also, even in competitive markets like England, regional champions have emerged, either via local authority group procurement, or (more recently) solid organic growth for local options like Pupil Asset in Norfolk.
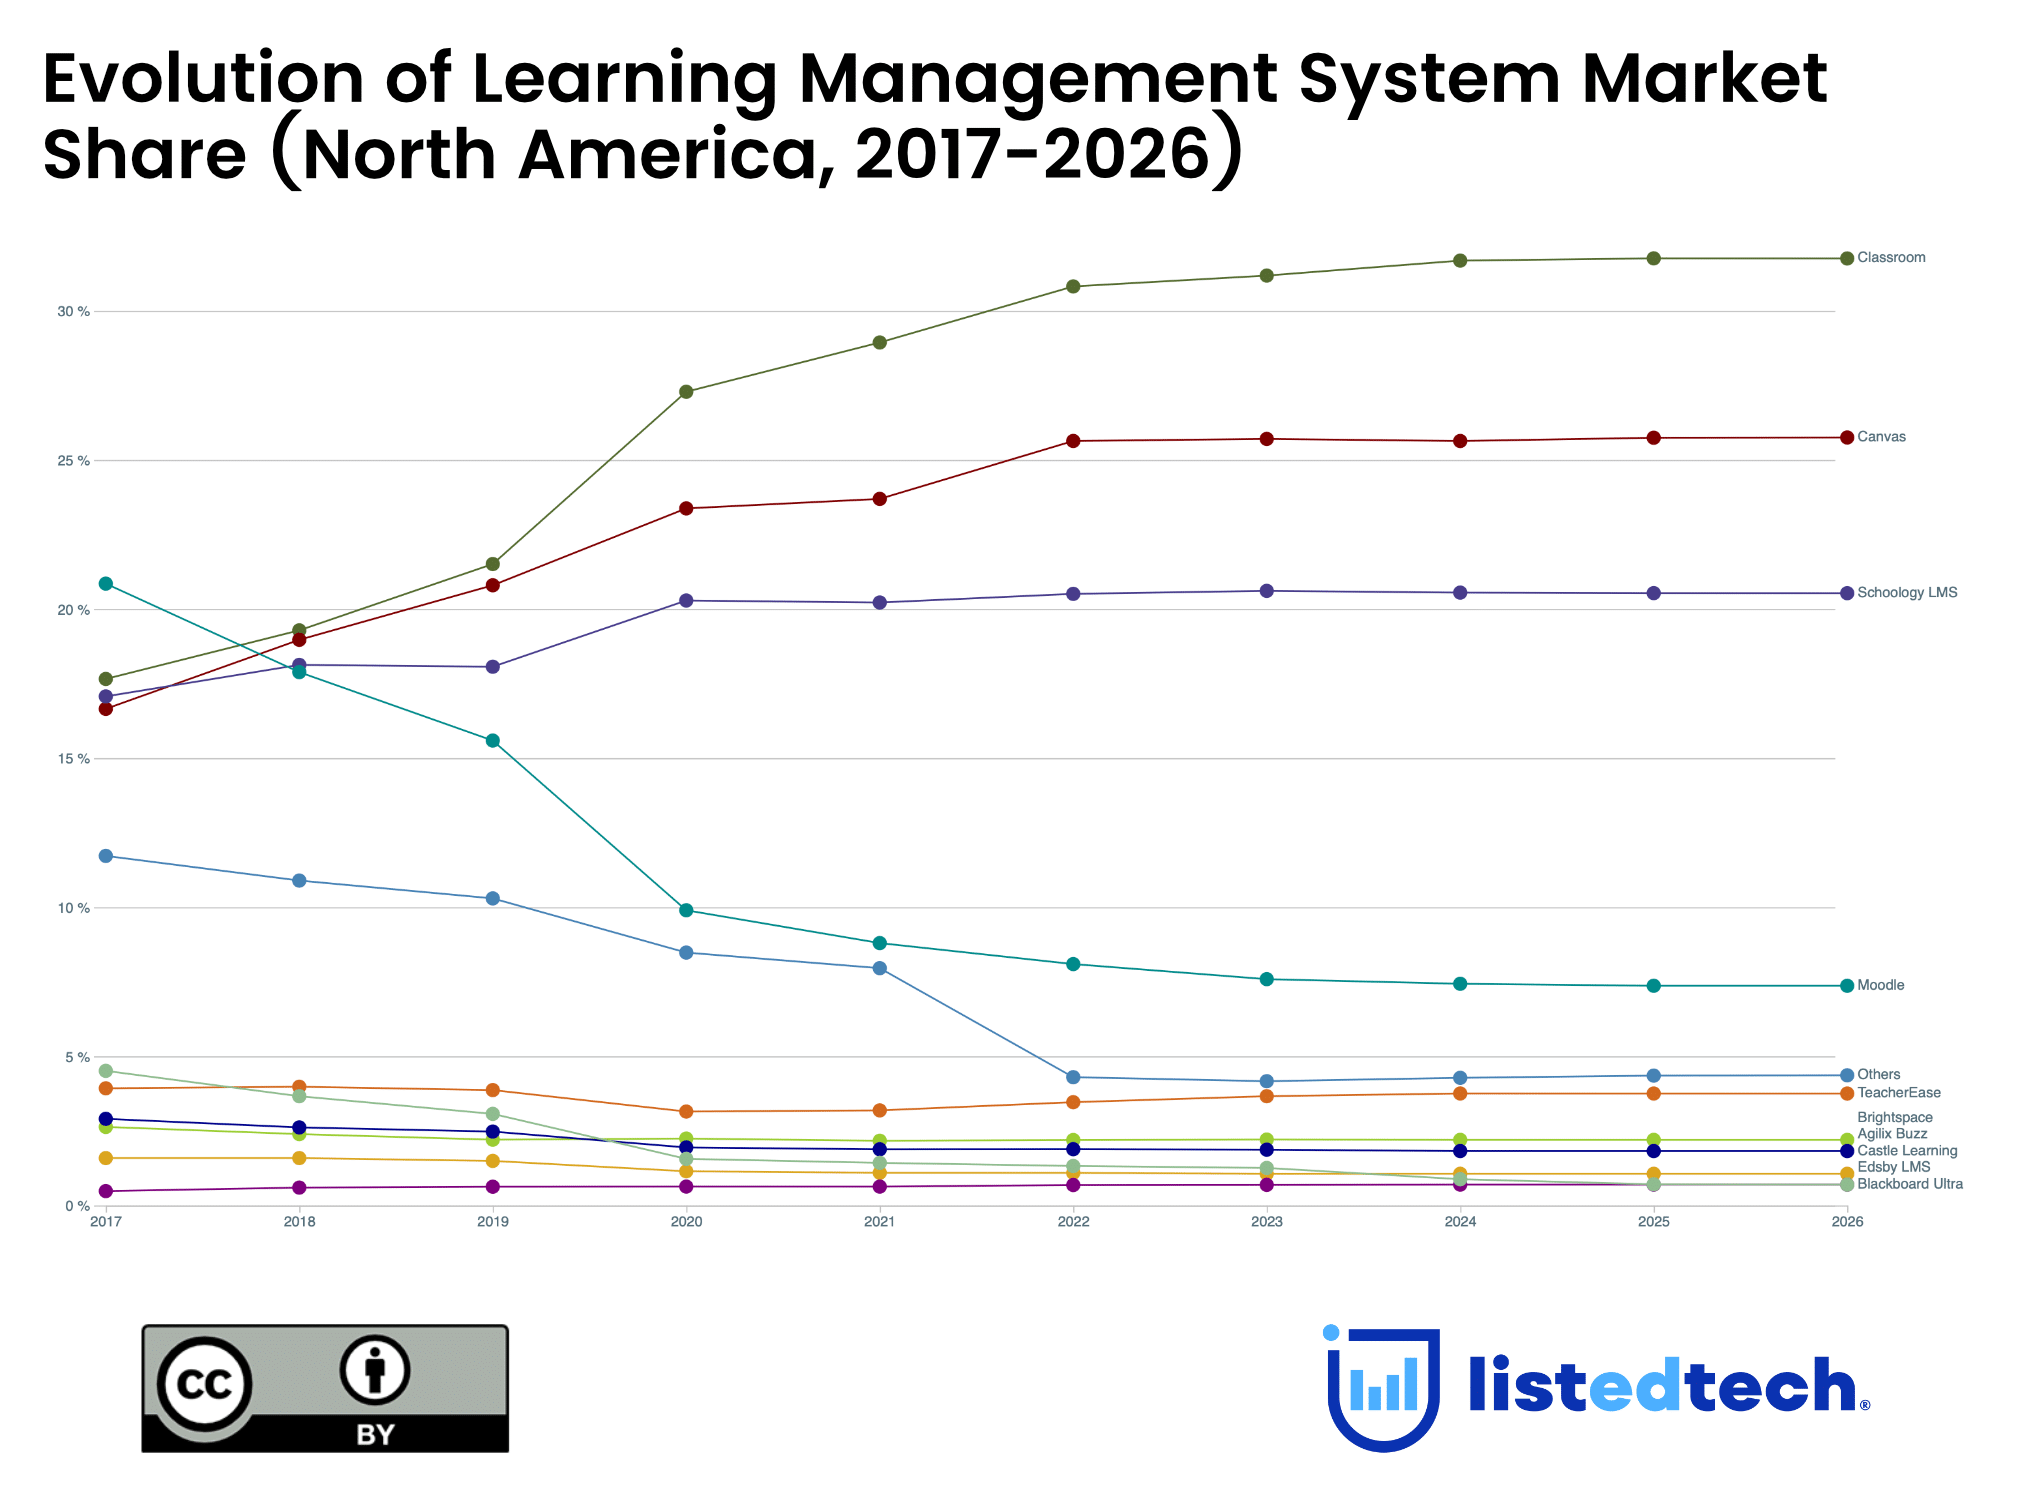
It’s quite hard to grow (or shrink) by more than 1 percentage point in a year. I mean you can… but to do so you’re probably going to have to win (or lose) one very large contract, and there ain’t many of those around. In North America, the biggest win of the past decade appears to be Aspen recently taking central Canada from Trillium, taking their overall North American market from 1.7% to 7.1%. But that’s really the only move of anything like that magnitude I can find – and it followed eight years of steady decline for Trillium. In terms of what that says for the UK, it may make SIMS nervous about their ability to hold on to the Northern-Ireland-wide contract they’ve held for as long as I can remember. Or, to put it another way, just because you’ve locked down a market for a long time, you should not assume you’ll keep it forever, particularly if your product trend-line is already downwards.
It’s hard to differentiate yourself in a mature market. My third viz shows the % of “won” contracts in a given year, and my main takeaway is “meh, nobody’s really dominating the wins”. My hunch is that this is a byproduct of how hard it is to differentiate yourself as an SIS. I once sat in a procurement beauty parade where the CEO of the commissioning group said to the vendor I was accompanying: “I’ve seen the red one and the blue one; now I’m talking to the white one. Tell me why I should remember anything else that’s different about you?” The salesperson did a valiant job of responding, but honestly, I wasn’t convinced the CEO would remember the difference afterward. Now, to be clear, I think there are meaningful differences between vendors, but I’m a nerdy market-watcher, and most commissioners aren’t. So other than cloud vs non-cloud (yes, our dominant vendor in the UK is still locally hosted!), the data suggests that it’s really hard to craft a marketing message that will win you more than a quarter of the available switchers.
It’s ok to be smaller, but you don’t want to be one of the smallest. My fourth viz shows the losses by year, and what struck me was that the largest group in most years is “others”. What this tells us is that the smallest vendors have struggled to hold on to their schools. I’ve given a vendor their own colour/segment if they have c.250,000 students (which is more or less the top 20 vendors in the market). In 2018 those 20 held data for 36m students, whereas the remaining long tail shared under 3m students. However, those smaller vendors represented fully one-third of the losses in the year. My conclusion from this is that further consolidation – both in the UK and in the US – is likely. If you’re a smaller vendor, you’ll be looking nervously at the budgets and marketing clout of the bigger vendors, and every loss could feel like a threat to your survival. And equally, from the other side, those larger players may well be attracted by acquiring a ready-made chunk of market share in one go. Like I say, it’s really hard to grow by even 1%, so if you can buy – say – half a percent of market share in one acquisition, it’ll make a meaningful difference to your scale.
Finally, some brief notes and observations:
Justin’s dataset is district-based, whereas my normal dataset is at the school level.
I’ve focused on % market share when visualising data as opposed to actual student numbers because Justin has increased his national data collection coverage in every year, so the raw totals wouldn’t necessarily offer a good like-for-like comparison.
As Justin pointed out in his blog, none of the US vendors has a UK presence. That’s pretty wild when you consider how much edtech software does work both sides of the Atlantic.
For any questions about the data used for the graphs in this post, or to find out about subscribing to ListEdTech’s range of reports, please contact Justin using their website.