Article is by Phil Hill and Cross-posted at e-Literate Over the past several months, we have worked with our partners at eLiterate as we have ramped up our efforts to collect data on LMS usage in the K-12 market in the United States. This is a massive effort as the market includes more than 130,000 individual public and private schools, and more than 13,600 school districts, according to recent NCES documentation. We are aware of several private data sources with estimates on the K-12 LMS market, but there are no public sources.
Part of the challenge is that the K-12 market is messier than higher education’s and its roughly 7,200 institutions. One reason is that the general IT infrastructure in K-12 is less mature than in higher ed, and for smaller schools there are a lot of ad hoc implementations running on a local server not even in a data center. Another reason is the availability of free options such as Google Classroom, or freemium options such as that offered by Schoology and Canvas for individual faculty.
As we build up the data and improve our methods, we believe we are starting to see some interesting trends in the data worth sharing.
Our initial sample looks at 6,875 public schools from across the country in the NCES-designated primary, middle, high and other (special ed, vocational or alternative) categories. These results were analyzed over several data collection methods along with manual evaluation of that data. That said, we expect to see movement in the numbers as we collect and verify additional data, including LMS usage at private schools.
As in our analysis of the higher ed market, we are focusing on school-wide implementations of LMS platforms. At many K-12 schools, in the absence of a school-wide implementation, individual teachers opt to use an LMS for their particular classroom, often for free. We do not consider this case a school-wide adoption and therefore do not include those use cases in our data. This methodology does not fully analyze total usage of a platform like Schoology that has a freemium model, including a free option for individual teachers and an enterprise solution which is a school-wide adoption based on a fee per student model. A platform like Google Classroom likewise has usage by individual teachers as well as school-wide implementations.
Before we share the preliminary data, some caveats are in order to hopefully avoid anyone misrepresenting this information:
This is preliminary data that will likely change as we learn more. While we believe there are some broad trends already emerging, there will be refinements as we increase our coverage over time. We expect the changes to be in small adjustments to specific numbers but not in big changes to market shape.
This view is based on number of schools that have implemented an LMS, which is a different metric than district-wide implementations (where many or most of the purchasing decisions occur) or implementations scaled by student enrollments. We will add these views in the future.
This view is based on installed base (which represents total estimated deployments), which is different than new implementations in a given time period (which would measure market momentum). Again, we will add these views over time, just as we have done for the higher ed LMS market.
Due in particular to the free options available in K-12, there will be schools that have more than one LMS available at the institutional level. Google Classroom in particular is often available as an option at a school even when there is another LMS.
As is our practice at e-Literate, we’ll describe the caveats and present the data as is. As we learn more, if the relative percentages change significantly, we will share updates.
For more information on our data methods, see this post.
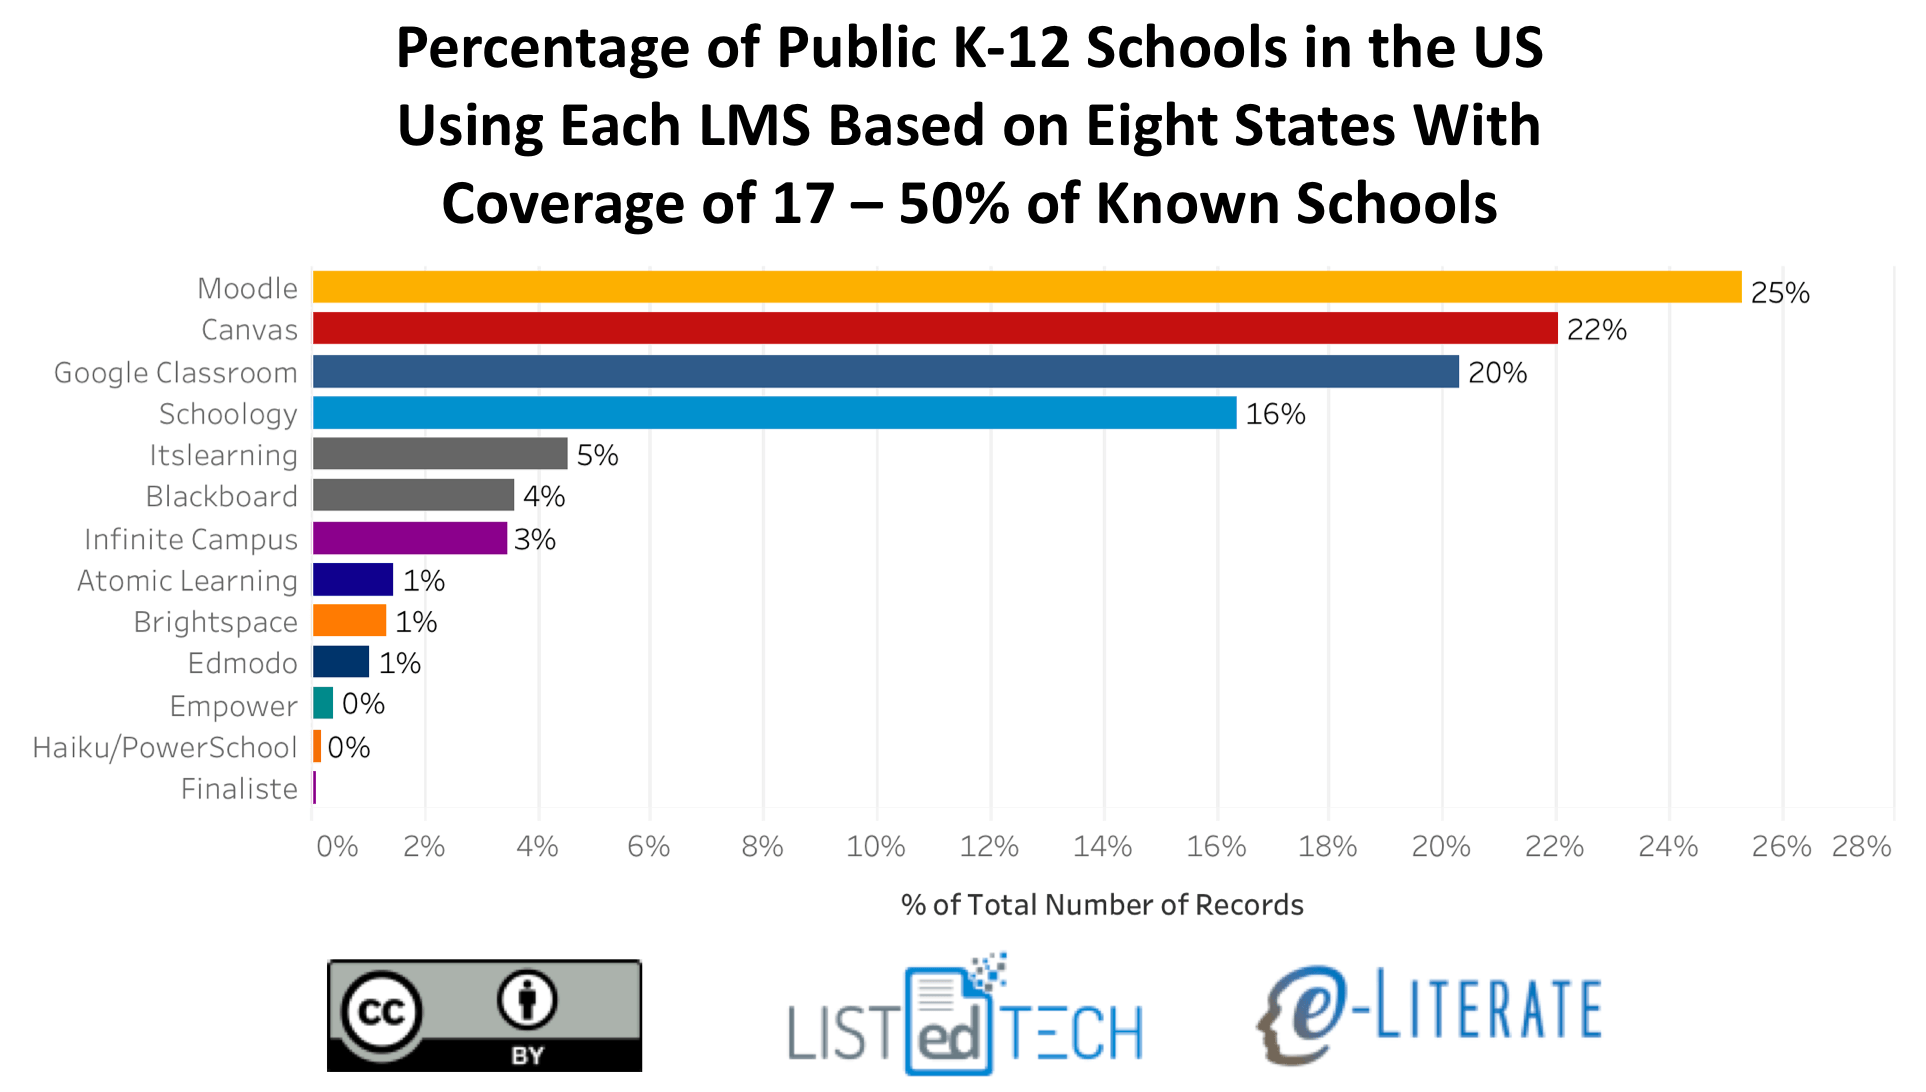
The first graph presents a view of K-12 school-wide LMS implementations in the United States for the 8 states (and DC) where we have at least 17% coverage of known schools (Alaska, Delaware, District of Columbia, Florida, Massachusetts, Minnesota, Texas, Wisconsin).
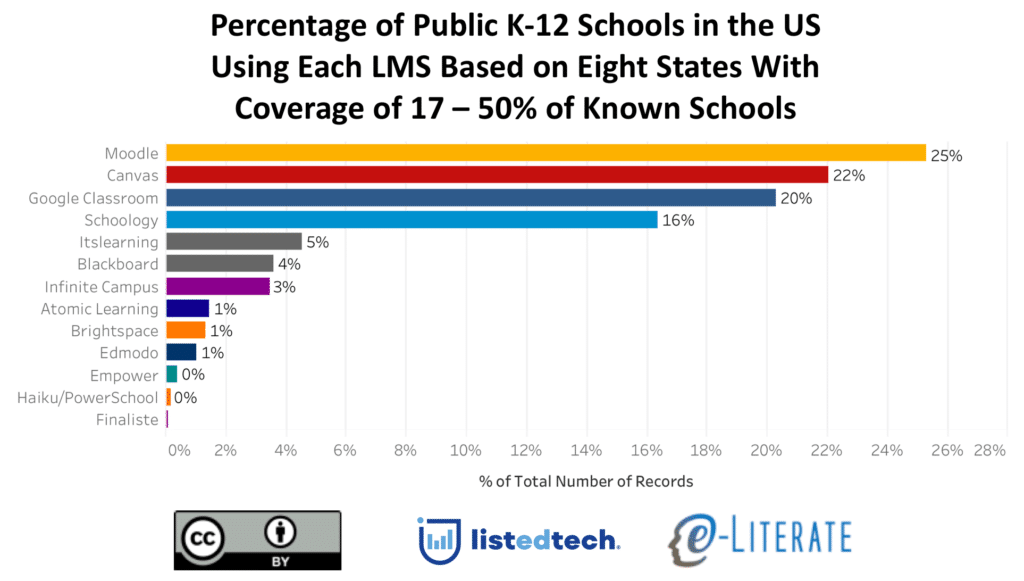
To get a sense of how representative this initial market share is, we made the same calculations across all 6,875 schools from 50 states and DC that in our data thus far. The data for each LMS matched within ~2% for each LMS (e.g. Canvas went from 22% to 24%, Moodle went from 25% to 24%) between the two views.
As in the higher education market, there appears to be four top contenders in K-12 – Moodle, Canvas, Google Classroom, and Schoology – with all others having 5% or less of market share. Moodle and Canvas are both present in the Big Four for both higher education and K-12, but in K-12 Google Classroom and Schoology are the other big players. We believe that this is the first data set showing just how widely Google Classroom has been adopted.1
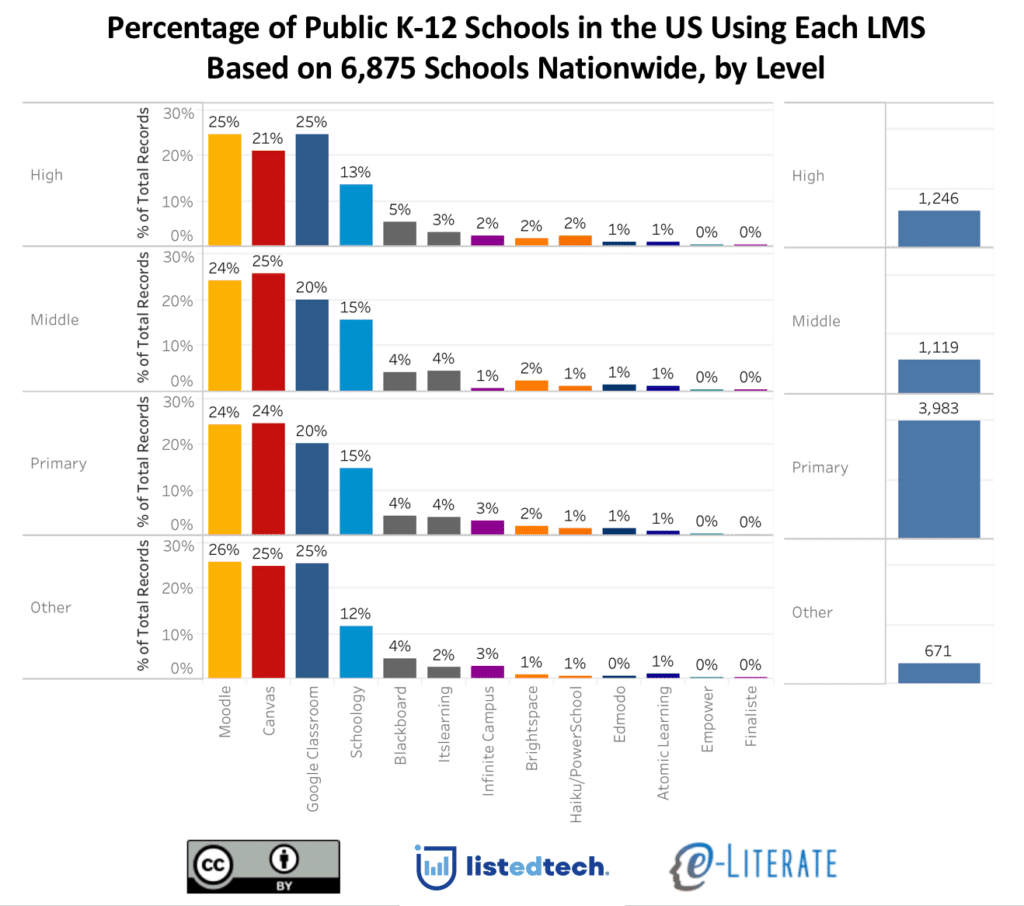
The general distribution is somewhat consistent across school levels – primary, middle, high school, and others – with some interesting smaller variations. The following view also gives a sense of our relative data coverage by level. In this case we are using all our data across the 6,875 schools. Note that totals are higher than this number due to multiple systems being available at some schools.
We hope this new data provides a broader view of the academic LMS market. We’d love to hear your feedback and questions.