ListedTech
  • Data Portals
    • Portal for Industry
    • Portal for Institutions
    • Webinars
  • Product Categories & Reports
  • Resources
    • Blog
    • Podcast
    • Documentation
    • Webinars
  • About Us
    • Our Story
    • Data Overview
    • Traditional IT Research vs. ListEdTech
    • In the Media
    • Contact Us

Search the website...

Go to Portal
Posted on November 11, 2017 | by Justin Ménard

Student Information System Software by Total Enrollment

Student Information Systems
SIS by Enrollment - LisTedTECH

When a post-secondary institution wishes to change its Student Information System software, what is the first question they ask? It’s usually either What system is my neighbour using? or What system is used by institutions of my size?

About five years ago when my university (University of Ottawa) started looking for a new Student Information System software to replace our homegrown system, I wish we would have had access to this information, particularly in a graph such as the one below.

Interested in HigherEd Technology? Sign up to receive our free weekly newsletter! We hand pick the most relevant, interesting and important stories affecting HigherEd IT professionals in product selections, implementations as well as system retirement.

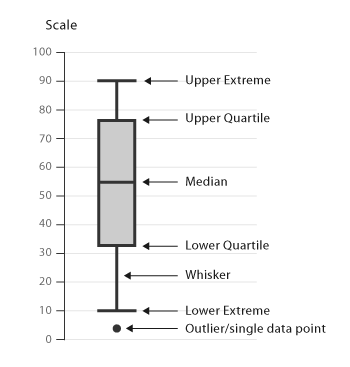
In order to understand Box-and-Whisker Plot graphs, here are a few explanations.

First, you determine the median (value separating the higher half of a data sample from the lower half), then the upper and lower quartiles. Together, these form the “box” which is represented in orange. The upper and lower quartiles are the medians of the upper and lower half of the data set (light and dark orange).

Now the ‘whiskers’ are the minimum and maximum of the “standard” data set, represented by dark black lines in the graph.

Over and below these whiskers are the outliers; the data-points that are considered out of norm and which are outside the box plot.

Observations:

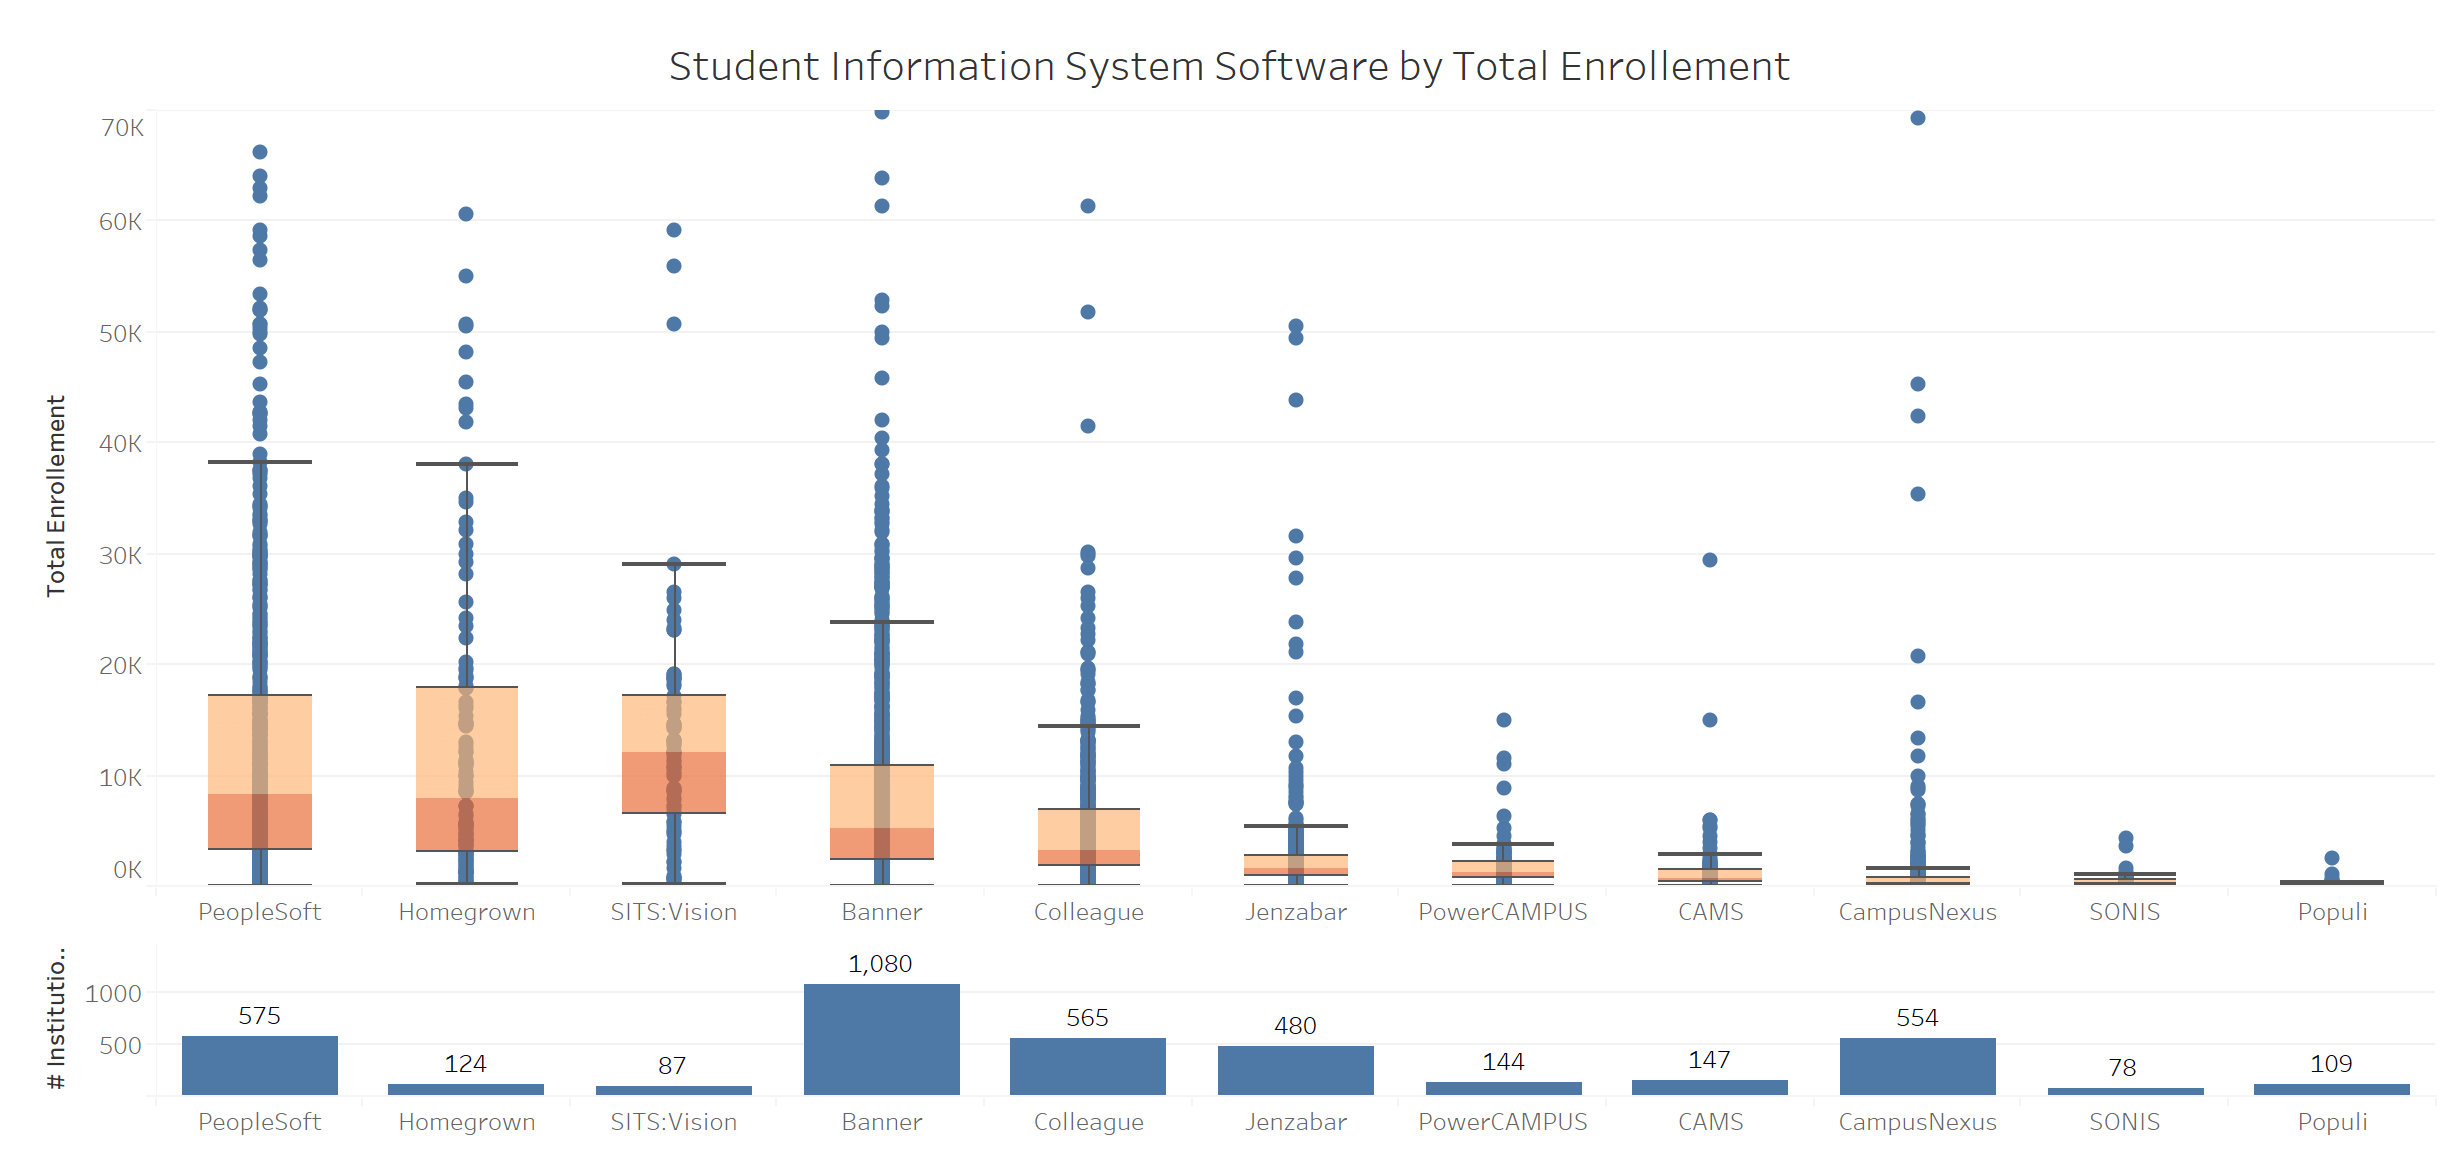
  • Peoplesoft by Oracle (median 8,315) has the largest spread. It has a client base consisting of mostly large institutions.

  • Homegrown (median 7,855) has an almost mirror profile to Peoplesoft.

  • SITS:Vision by Tribal Group (median 12,105) has the highest median.

  • Banner by Ellucian (median 5,256) has a large volume of clients in the 2,000 to 10, 500 range.

  • Colleague by Ellucian (median 3,247) has a concentration of midrange institutions.

  • Jenzabar’s (CX, EX) (median 1,562),PowerCampus by Ellucian (median 1,178) and CAMS by Unit4 (median 636) have almost mirror profile.

  • CampusNexus by Campus Management (median 371) and SONIS by Jenzabar (median 283) have narrow grouping of institutions if we base it on total enrollment.

  • Populi (median 128) has the smallest range toping at around 400. They are clearly focused on very small institutions.

ListEdTech tracks over 75 SIS products used in HigherEd; about a dozen of them are what we would consider having wide market appeal. For this graph, we only kept the SIS products for which we had at least 75 active implementations.

The Y axis was cut at 70,000. Very few outliers appear above that number but only for Banner and SITS:Vision systems. Since we are only looking at a subset of institutions for whom we had enrollment, the numbers don’t necessarily represent the total marketshare.

Post navigation

Mix and Match, SIS and Financial Systems in HigherEd
Student Information System Software by Total Enrollment v2
  • Subscribe to Our Newsletter
  • CAPTCHA image

    * All fields are required.

  • Listen to Our Podcast


  • Recent Posts

    • Who Are HigherEd’s Tech Leaders? October 15, 2025
    • Anthology’s Chapter 11 Filing: Breaking Up to Refocus October 1, 2025
    • Rethinking Market Saturation in EdTech September 24, 2025
    • Thesis: From Unit4 Spin‑Off to SIS Specialist September 17, 2025
    • How Institutions Discover What Tech Their Peers Are Using September 3, 2025

Stay in the know…

Blog & News
Higher Ed Market Data

Who Are HigherEd’s Tech Leaders?

This year, I’ve been revisiting some of the classic business books: Blue Ocean Shift, Free, The Innovator’s Dilemma, Zero to One, and of course, Crossing the Chasm. That last one really got me thinking about early adopters. In tech markets, they’re the people (or in HigherEd, the institutions) who are comfortable taking risks, trying something new, and shaping the market ... Who Are HigherEd’s Tech Leaders?  Read More
Market Data Market Movements

Anthology’s Chapter 11 Filing: Breaking Up to Refocus

September 2025 marked a major turning point for Anthology, the owner of Blackboard and several other higher education technology platforms. The company filed for Chapter 11 bankruptcy in the U.S. after efforts to sell itself or parts of its business outside of court failed. The filing is not a liquidation. Instead, it is a structured reorganization designed to ... Anthology’s Chapter 11 Filing: Breaking Up to Refocus  Read More
ListEdTech Market Data

Rethinking Market Saturation in EdTech

Market saturation is a concept we often discuss at ListEdTech because it comes up frequently with our clients. Investors want to know if a market still has room to grow, while startups want to understand whether they are entering a space with opportunities or one that is already crowded. Last year, we explored saturation by ... Rethinking Market Saturation in EdTech  Read More
Footer Logo - LisTedTECH
  • Contact Us
  • Frequently Asked Questions
  • Privacy Policy
  • Terms of Use