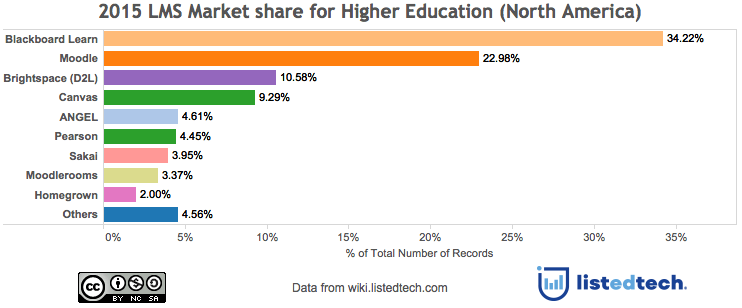
The Higher Education market share for Learning Management Systems (LMS) has been looked at and tracked for as long as they have been used in colleges and universities. For years, The Campus Computing Project has been the reference used to get better insight on the LMS usage in HigherEd. This information is based on surveys of institutions (the 2014 edition is based on 470 responses). In the last 5 years or so, Phil Hill’s one pager of the HigherEd market share has probably been the most cited graphic on the subject. Edutechnica is another website that has given us LMS stats. Its information is collected by automated scraping of websites. The graphic below is based on 3,965 higher education institutions contained in the ListEdTech wiki. The data only reflects the main LMS used at colleges and universities.
2015 LMS Market Share in North America (Higher Education)
These historical trends have usually been tracked using year over year percentage of total usage. This is great, but it’s harder to see micro trends or actual changes in the market since some of the data gets canceled out. An example of this would be:
If institution A moves away from system #1 and selects system #2 while institution B moves away from system #2 and selects system #1 in the same year. This gives us the same number of total users for each product. We lose the actual number of movements in the markets.
What LMS was selected?
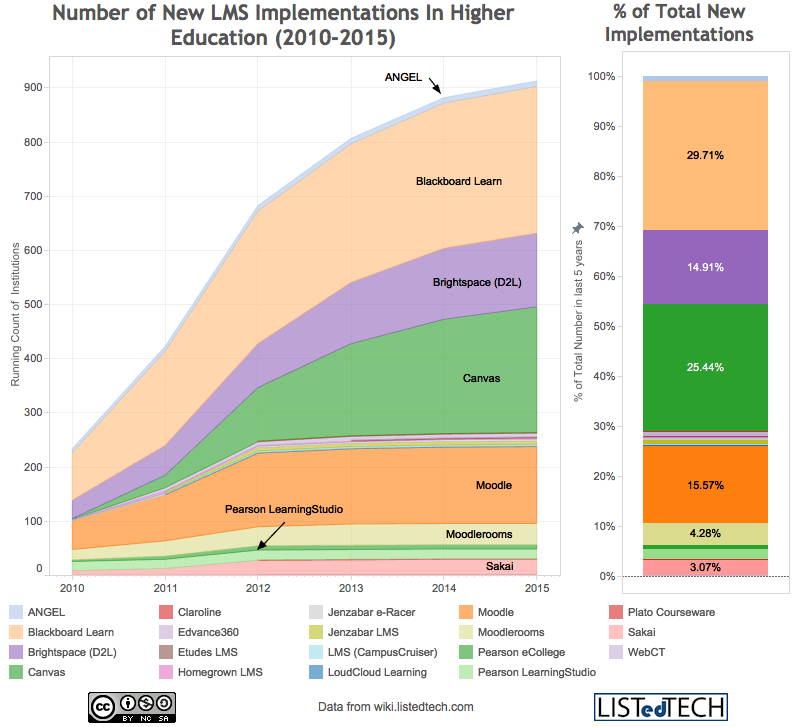
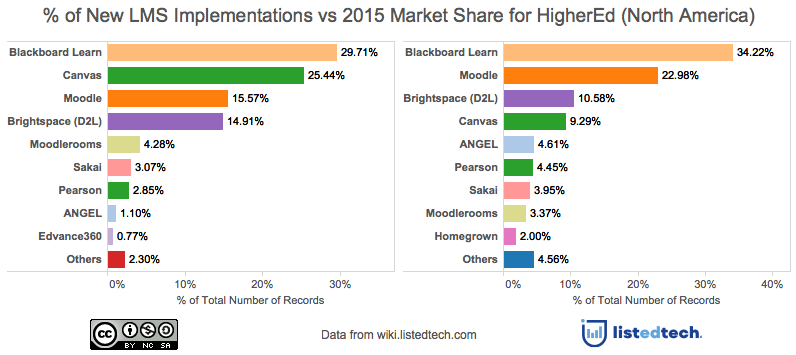
Another way of looking at LMS trends would be to look at the new systems that have been implemented in the last few years. This would show us what LMS colleges and universities are currently selecting. To do this, we looked at 912 LMS implementations from 2010 to 2015. This excludes renewal or system upgrades and only looks at colleges and universities that have changed system in the last 5 years.
As you can see in the graph below, Blackboard Learn (29.7%) is the most selected product followed closely by Canvas (25.4%). Then we have Moodle (15.6%) and Brightspace (14.9%). The top four systems account for over 85% of new implementations.
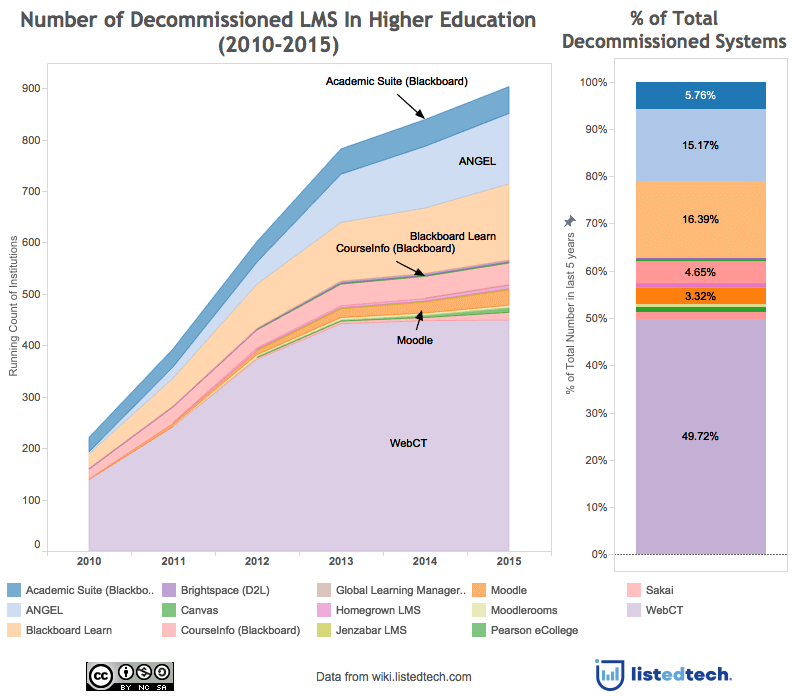
What LMS did colleges and universities stop using?
As you can see, WebCT has been the most decommissioned system in the last 5 years and this can be explained by the termination of the support for that product by Blackboard (more info on the post I wrote). The other LMS that are being decommissioned are Learn, ANGEL, Academic Suite and Courseinfo. We need to be careful when we interpret this data. It’s not that HigherEd is running away from Blackboard but rather that they are forced into looking for a new system since WebCT and ANGEL (about 65% of the decommissioned LMS) are being discontinued.
LMS Trends
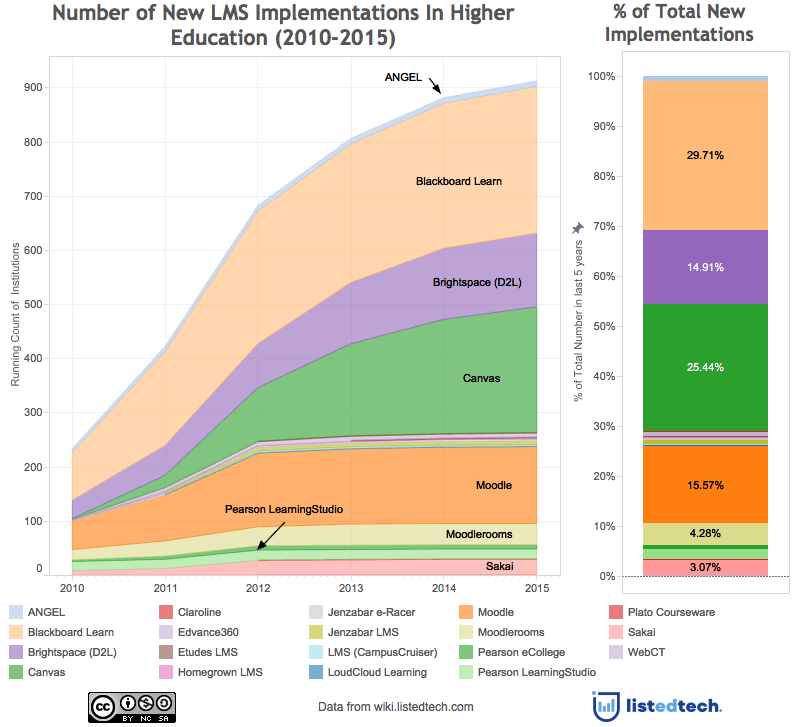
In order for a LMS to maintain its market share, it needs to have the same percentage of new implementations. By comparing new LMS implementations (912 in last 5 years) and total LMS market share (3,965 in 2015) side by side, we can see a few interesting trends.
- Blackboard and Moodle’s market shares seem to be declining.
- Canvas is definitely on the rise. It’s being selected in a quarter of colleges and universities.
- Brightspace is improving its market share.
- Moodlerooms, Sakai and Pearson are maintaining their market shares.
- Homegrown systems are no longer in the top 10 options considered.
What are your thoughts on this? Should we look at the data in another light?