When we want to implement a new learning management system, we often face the same questions:
- What system should we get?
- How much time will it take to implement?
- How much will it cost?
These questions are also valid for any implementation. We are happy to share our knowledge about these critical interrogations with our extensive database, now accessible through the institution lookup portal. On the Trends page, it’s easy to navigate through the different visualizations to better understand what a new implementation can involve.
This article focuses on the contract prices graph for the learning management systems (one of the 21 product categories available on the portal). Updated daily on the portal, this graph shows the historical pricing of HigherEd LMS in North America. Although we consider the contract price chart preliminary, we have data on over 2000 contracts between higher education institutions and vendors. As we add new contracts to the database each day, the data in real-time may change slightly.
To build this specific visualization, we try to be as precise as possible to offer valuable information. We established a specific set of rules:
- If a contract covers multiple campuses, we divide the contract amount by the number of campuses and divide that amount by the number of students on each campus.
- If a contract is for multiple products and does not mention the financial breakdown per product, we equally divide the amount.
- If a contract covers multiple years, we break it down so the data would be spread across each contract year.
- We take the student count from the closest year of the implementation date. For example, if the contract is for 2015, we select the total number of students for that year.
- In the event of a multi-year contract, we take the student enrollment for each year of the contract.
- We use the IPEDS’ total fall enrollment numbers for that year or the closest year available.
- We include all LMS used in higher education, including Blackboard, Desire2Learn, Instructure, Moodle etc.
- We aim to only keep the actual LMS and hosting costs.
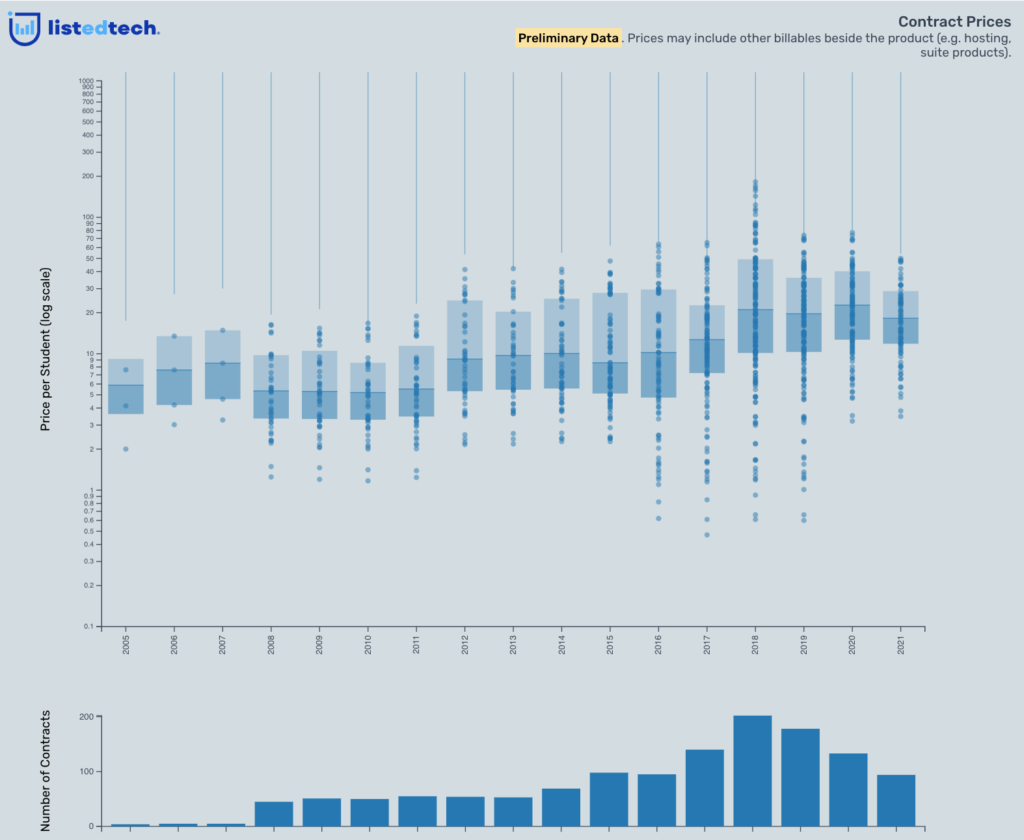
Before analyzing this data, allow us to refresh how to read a box-and-whisker plot:
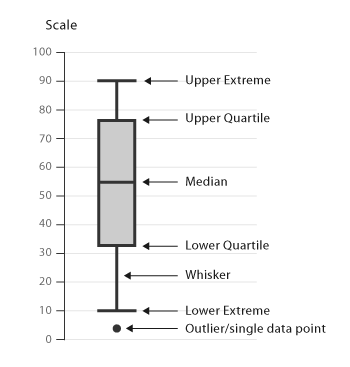
First, you determine the median (value separating the higher half of a data sample from the lower half), then the upper and lower quartiles. Together, these form the box. The upper and lower quartiles are the medians of the upper and lower half of the data set.Now the ‘whiskers’ are the minimum and maximum of the “standard” data set.Over and below these whiskers are the outliers, the data points considered out of the norm and outside the box plot.
It is important to note that this view represents an analysis using preliminary data. With that in mind, here are a few notes:
- When we look at the medians, we see that, between 2005 and 2021, the cost per student went roughly from $10 to $20.
- The modern LMS is much improved from the 2000s version. The better system stability, better intuitive user interface and better support can explain the increase more than inflation.
- Almost all new implementations include hosting which is included in the pricing.
We have a few questions that remain without answers:
- How to interpret outliers?
- Is there a significant difference between open-source and proprietary products that could suggest adding another filter to this viz?
- How to integrate companies that sell a product but also have many “free” products that are included?
If you have any suggestions on these questions, feel free to comment.
The chart in this article is aggregated for higher education institutions in North America. What differences do we see by geographic region, by institutional size, by institutional sector? We encourage you to explore the data by filtering it directly on the portal. Learn more about the possible upgrades for your team.