Following the massive implementations of conferencing, proctoring and learning management systems solutions mostly due to the pandemic outbreak that started in March 2020, we could say that 2021 was relatively calm in terms of new product implementations. Is it really what happened during year 2 of the pandemic? Have we seen peaks in other product categories? Here is our semi-annual update on product implementation peaks; where we look at the last decade of implementations to give a more general trend overview.
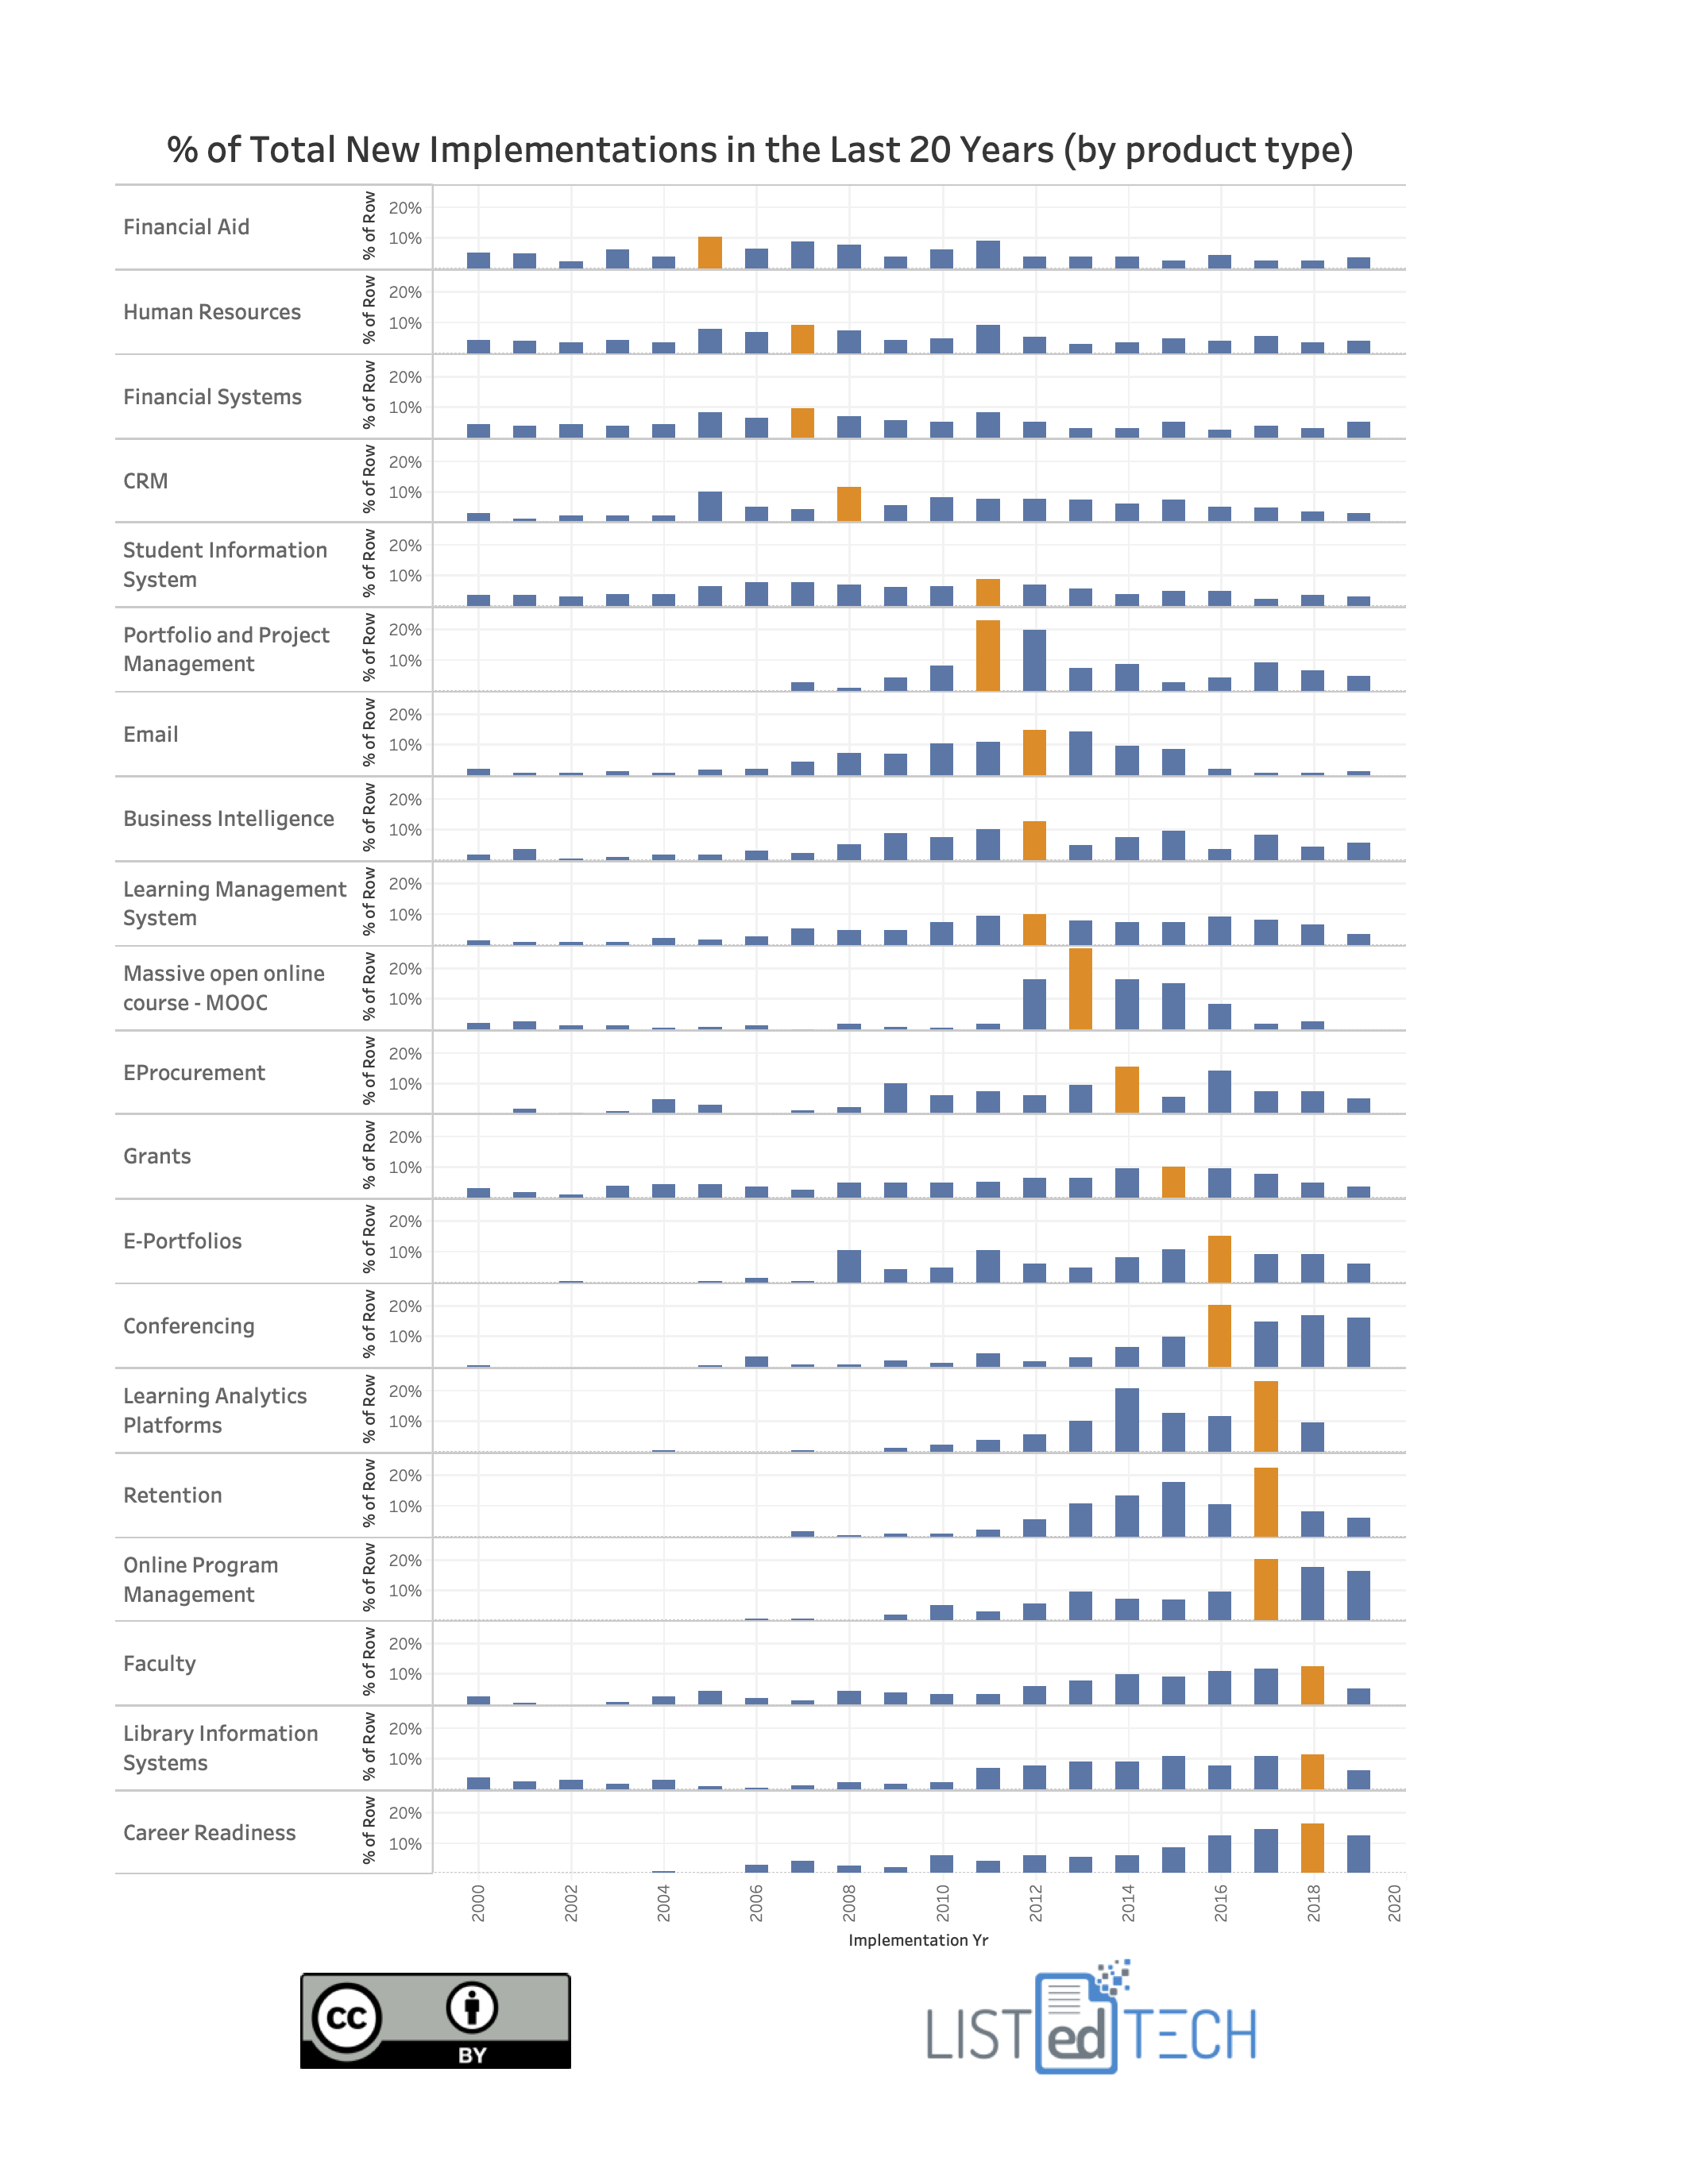
The graphs below show the percentage of product implementations in the USA and Canada each year, from the year 2010 up to and including 2021. In last year’s article, if you remember, we had the data from 2000 onwards. This year, we want to focus the data on the last 12 years to show the most current trends in IT systems. As our readers know, our data is always trailing (more info to come in a future post). For this reason, we have increased the 2020 data by 15% and increased the 2021 data by 35%. We came up with these numbers based on historical data.
How to read the graphs?
The orange tab represents the year with the highest percentage of new implementations for each product category. By looking at the data this way, we easily see when a particular group has peaked in implementations within Higher Education and K-12. Also, by placing the systems’ implementation peaks in reverse chronological order, the graph shows which systems are currently the target of large implementations. As you can see below, 2021 was not the peak year for any product category. However, we have to mention that Financial Systems and Human Resource Systems almost saw their biggest year in more than a decade. As mentioned earlier, with the trailing, we could see a few peaks in 2021. The Learning Analytics Platforms also performed well. This category had its best year since 2017. This could be attributed to distance learning in 2020 and the need to analyze the outcomes of such solutions.
As you can notice, some product groups have a few peaks of similar magnitude where implementations seem to follow a cyclical trend. We can often explain the peaks within these cycles by a particular system ceasing to exist (like WebCT in 2011), justifying the LMS implementation peak in 2012. Others have one clear peak which can be interpreted by the enthusiasm of the industry then quickly replaced by another system (i.e. MOOCs which have transitioned into OPMs) or again with the email system where, in 2012, institutions have migrated to the cloud. Finally, we saw a third type of implementation peak when the need for a new system comes from outside the walls of education institutions. With the pandemic hitting us hard in March 2020, governments urged K-12 and Higher Education to shut down in-person training and teaching, giving schools, colleges and universities no choice but to transition to online learning and use conferencing systems.
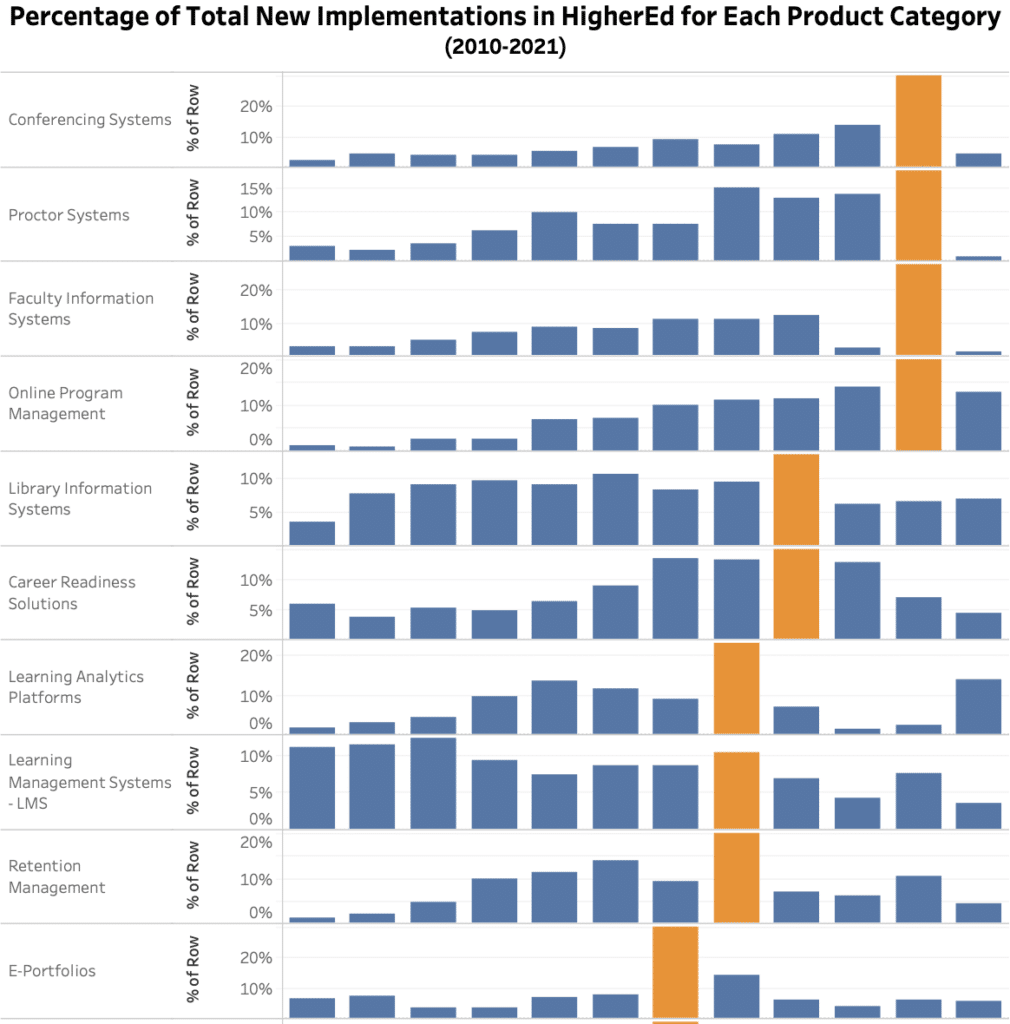
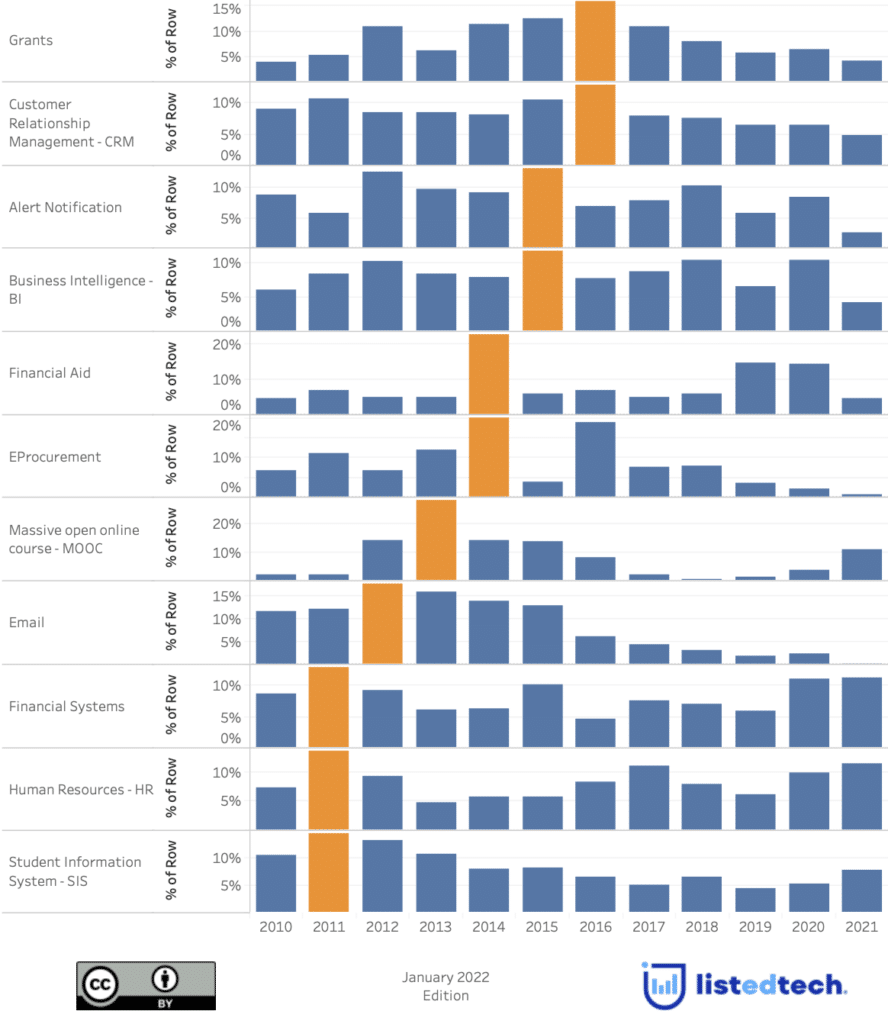
When we look at the HigherEd graph, here are some key observations:
- Conferencing systems, Proctor systems and Faculty Information systems exploded in 2020, but they almost vanished in 2021, contrary to what we mentioned last year.
- Online Program Management systems are the only category from the pandemic year that is still being highly implemented in 2021. With the transformation of the education world, universities and colleges require new revenues.
- Career Readiness Systems are in a downward trend since its peak of 2017. It would be interesting to see why this category does not see more implementations.
- Library Information Systems are starting a new cycle of implementations after its summit in 2018. If the cycle repeats, we could see a new peak within 2-4 years.
- Customer Relationship Management solutions and E-Procurement systems are in decline. For the former, we should expect a new peak anytime as it’s a steady product group with implementations each year and RFP numbers are increasing in this category. For the latter, we can’t predict a new summit based on historical data.
- Financial systems and Human Resource systems are in an upward trend.
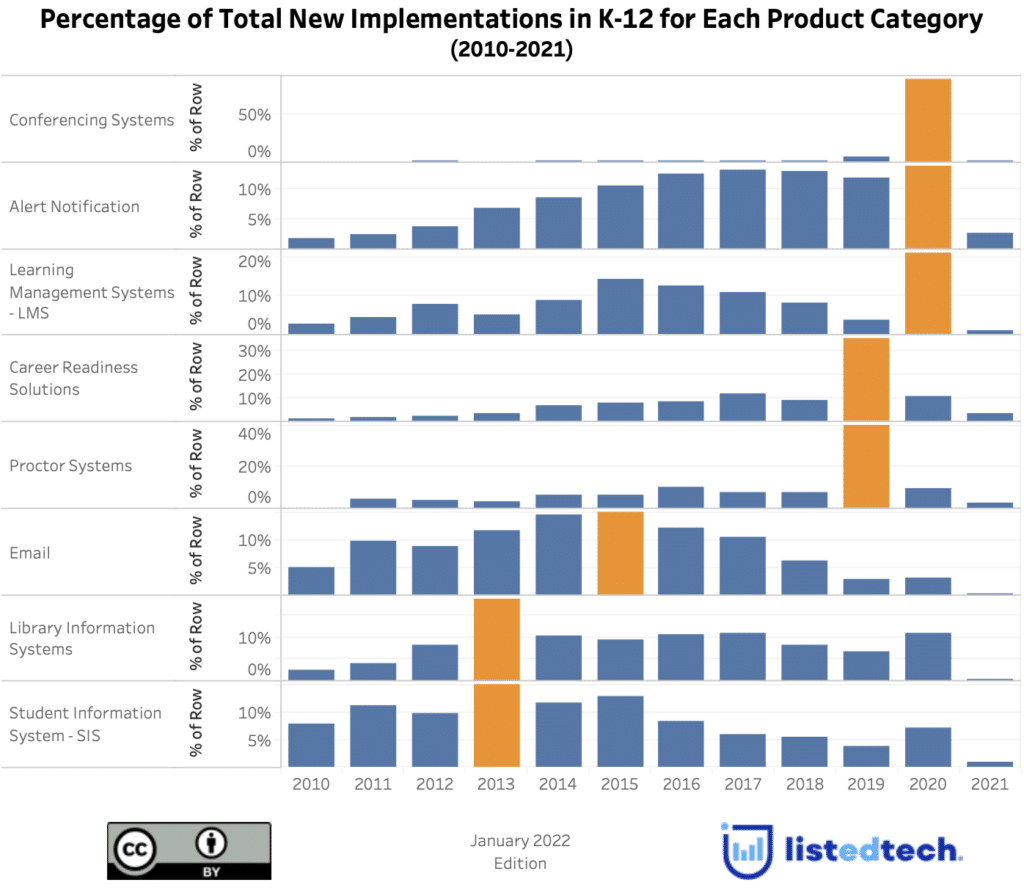
For the K-12 graph:
- The pandemic effect is mostly behind us for the K-12 implementations.
- Alerts systems are high. It could be part of the pandemic effect since some school districts have implemented COVID alert systems, but it could also be part of the general trend since the numbers have trending up in the last years.
- Student Information Systems seem to be in an upward trend when we look at the past few years. For the same reason, we will also watch Library Information Systems.
Data Note: Not all Y-axes are created equal. It is important to look at each Y-axis for the different product categories. They vary from 10% up to 50%. Contrary to Conferencing Systems (which saw enormous peaks in 2020 for HigherEd and K-12), LMS systems don’t have substantial peak differences (the Y-axis showing a maximum of 10% for HigherEd and 20% for K-12).
We would love to hear your predictions for the upcoming year. What do you think will be the most implemented product category? Comment on LinkedIn, Twitter and Facebook using #listedtech and #implementationpeaks.