In our last post, we used the LMS implementation dates to show how the market is evolving based on which systems are being selected for new implementations. In this post, we will also take into account decommissioning dates, so we are only left with active implementations per year. We’re proposing below an historical LMS overview of how the market of active implementations is being shared in North America.
The dashboard below proposes 2 different visualizations that represents how that market evolved in the last 20 years. See 2 top tabs
Each of the 2 tab can be viewed in 2 ways:
Where Blackboard is taken as a total of all its products (Blackboard + WebCT + Angel) “Blackboard Total“
Where Blackboard is divided into its different products “Products“
Blackboard
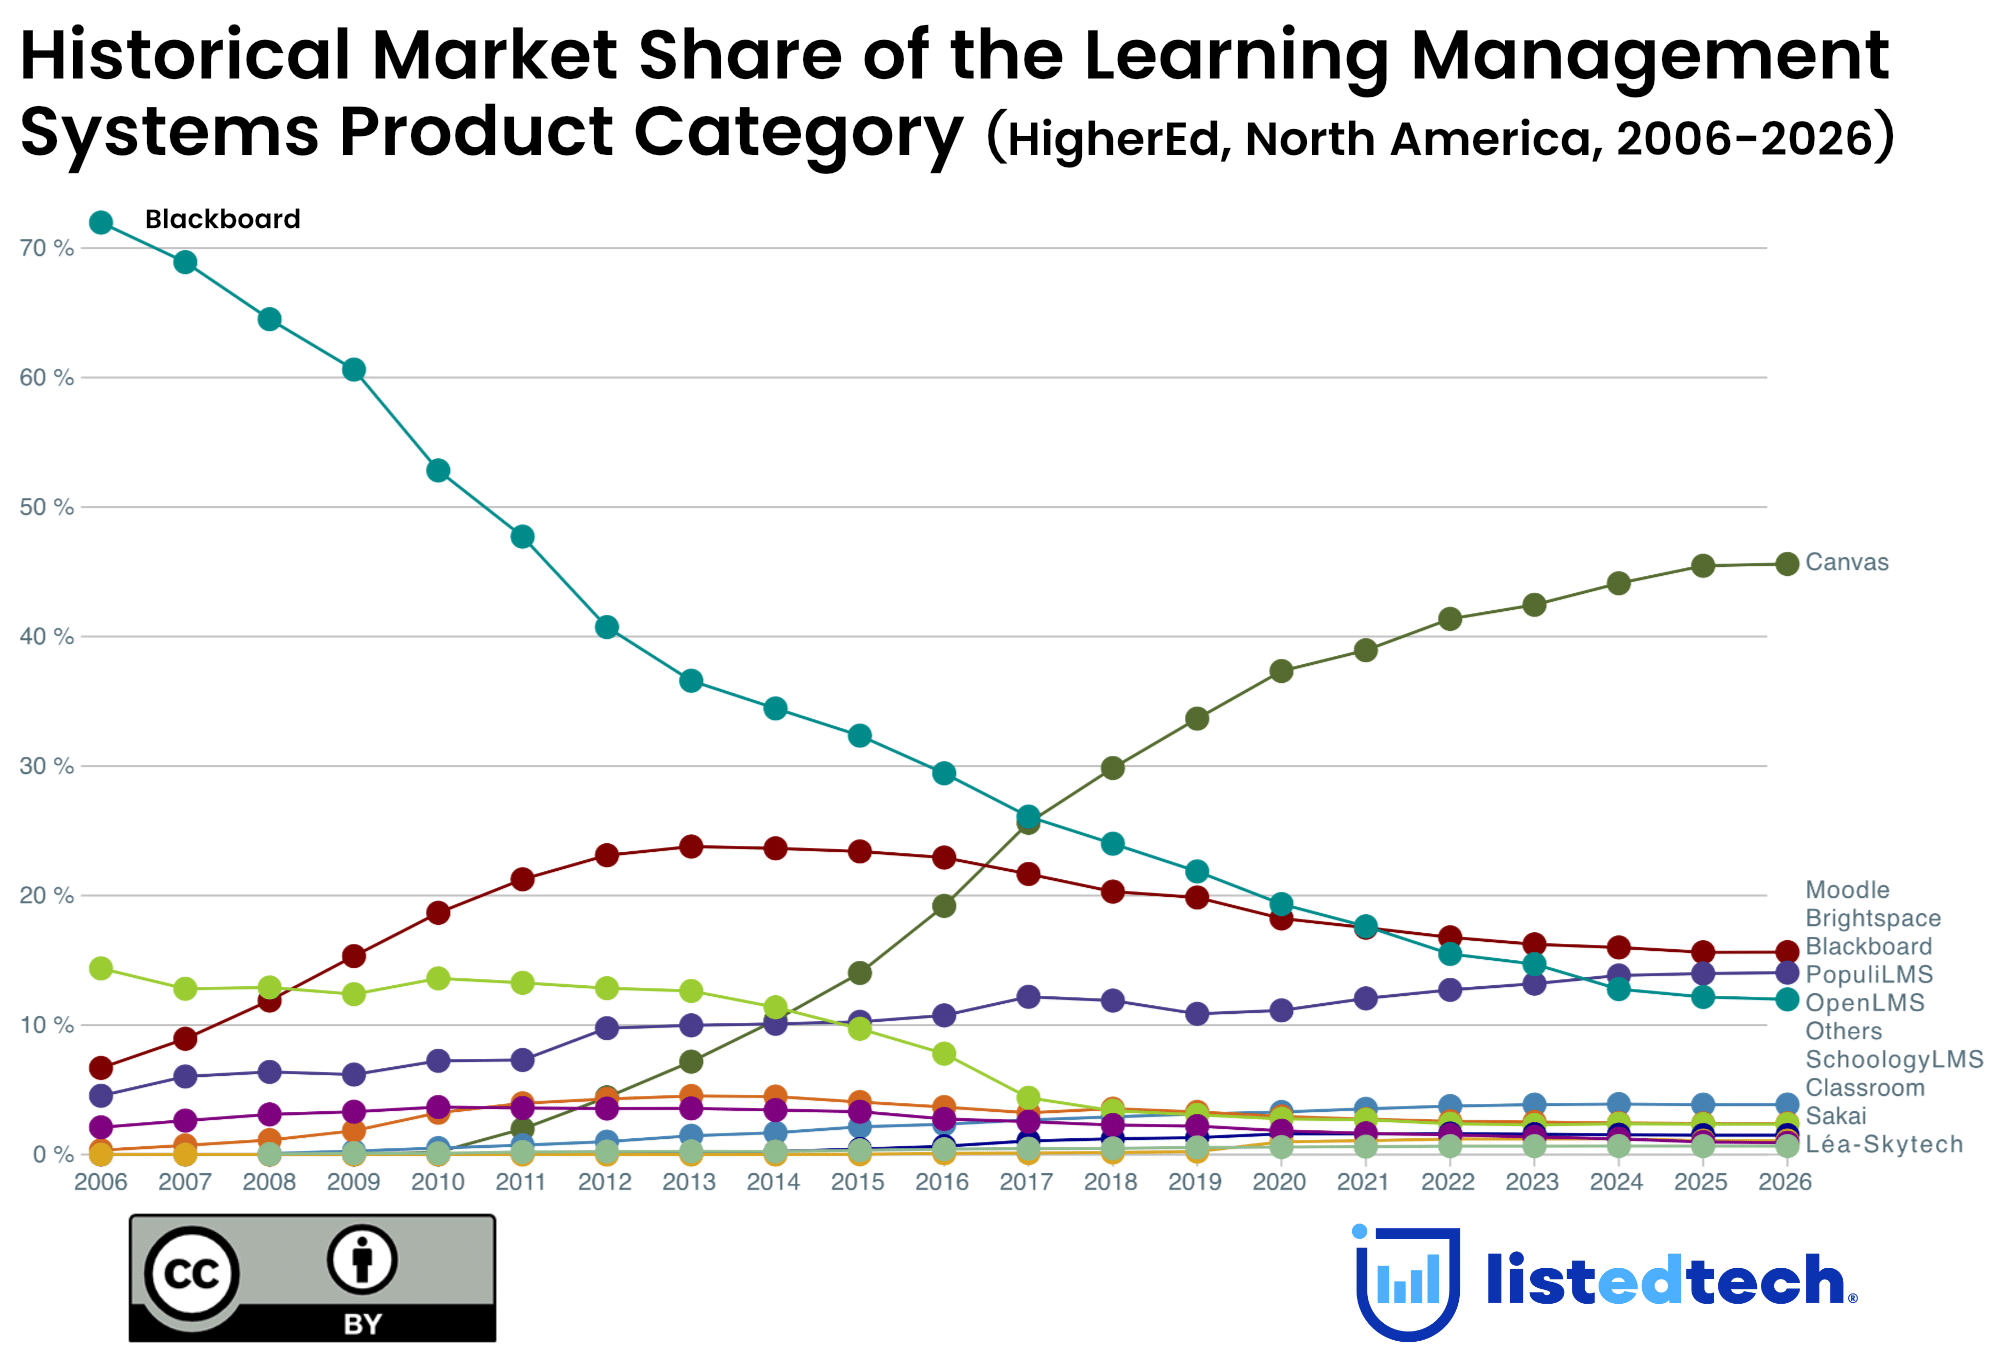
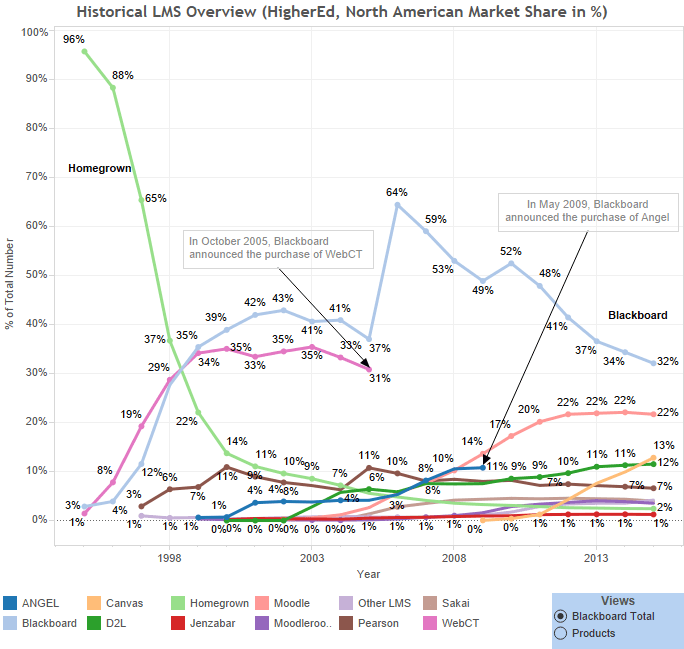
Let’s first look at the number of active implementations per year (first tab “#HigherEd by LMS”), segmented by “Blackboard Total”. We can clearly see how Blackboard increased their market share when it purchased and phased out WebCT in October 2005 and Angel in May 2009.
The second view (Second tab “Yearly % of Market Share”) shows the same data, but this time, based on the percent of market share for a given year. It clearly shows Blackboard’s decline. At its peak, it had close to 64% of the total North American market. It’s now at half that with about 32%.
Blackboard hit its peak (absolute numbers) in 2009 after it purchased Angel. Shortly after, it announced that it would stop providing support for Blackboard Vista. This seems to be their turning point, as it triggered the beginning of its ongoing slide. In 2013, 4 years after the Angel purchase, Blackboard had less active implementations than it did before it purchased Angel…
Homegrown
As the second tab “Yearly % of Market Share” clearly shows, homegrown LMS were initially the best and, until mid 1997, the only way to go. Since then, the market share of homegrown has clearly fallen from 96% to about 2%. Most of the remaining homegrown systems belong to the University of Phoenix who, as confirmed by e-Literate will be moving to Blackboard Ultra.
Moodle
Moodle’s meteoric rise has come to a stand still. It looks as if their numbers and market share have levelled off in the past 4 years. It does seem like Canvas has taken away a big part of their steam.
Moodlerooms and Sakai
Both LMS are slowly losing clients. They have been maintaining the same 4% market share for the last 4 years. This will most probably fall to 3% shortly.
D2L
D2L is still slowly increasing their total number of institutions, but their total market share is on the verge of falling from 12% to 11%. Most of its growth comes from Canadian institutions.
Canvas
We all know how fast Canvas is growing but if you look at Moodle, you can see how similar its growth has been between 2005 and 2010. (first tab) The main difference is how quickly Canvas exploded. Where it took Moodle 4 years to hit the 100 implementation mark, it only took Canvas 2.5 years. The two lines are strikingly similar; they have the same vertical slope. Can we assume that since Canvas has the same growth momentum as what Moodle had, that it will soon occupy a similar position in terms of market share?
As a side note: We know that Canvas is currently being piloted in 60+ higher education institutions. Those numbers are not reflected here, but we will be looking at this in our next post: who are the institutions that are piloting canvas and what LMS they are currently using.
If you would like to see a more detailed view based on a specific sub-market or would like to purchase the underlying dataset, please contact us.
A disclaimer on the visualization above. We try to control for the bias introduced in the way we capture data by validating our results with external sources of data if they exist. But as our data is somewhat novel, we cannot guarantee 100% representativity of the actual market. This also applies to how that market has evolved. We’ve tried controlling for bias by ensuring that all products have between 70% and 80% of the implementations and decommissioned dates of all LMS listings we have in our database. This prevents over-representation of a company based on more successful data capture of a company’s implementation or decommissioned data. But again, our findings can only be partially validated by a third-party source. So, although we try to take the necessary steps to provide our readers with the most representative findings we can extract from our data, the reader should be aware of possible bias introduced in our results.