In this post, we will look at how LMS providers are sharing the North American market based on new LMS implementations. As you know, the landscape of the LMS market is constantly changing. To visualize this movement, we usually look at year over year percentage change of a vendor’s market share.
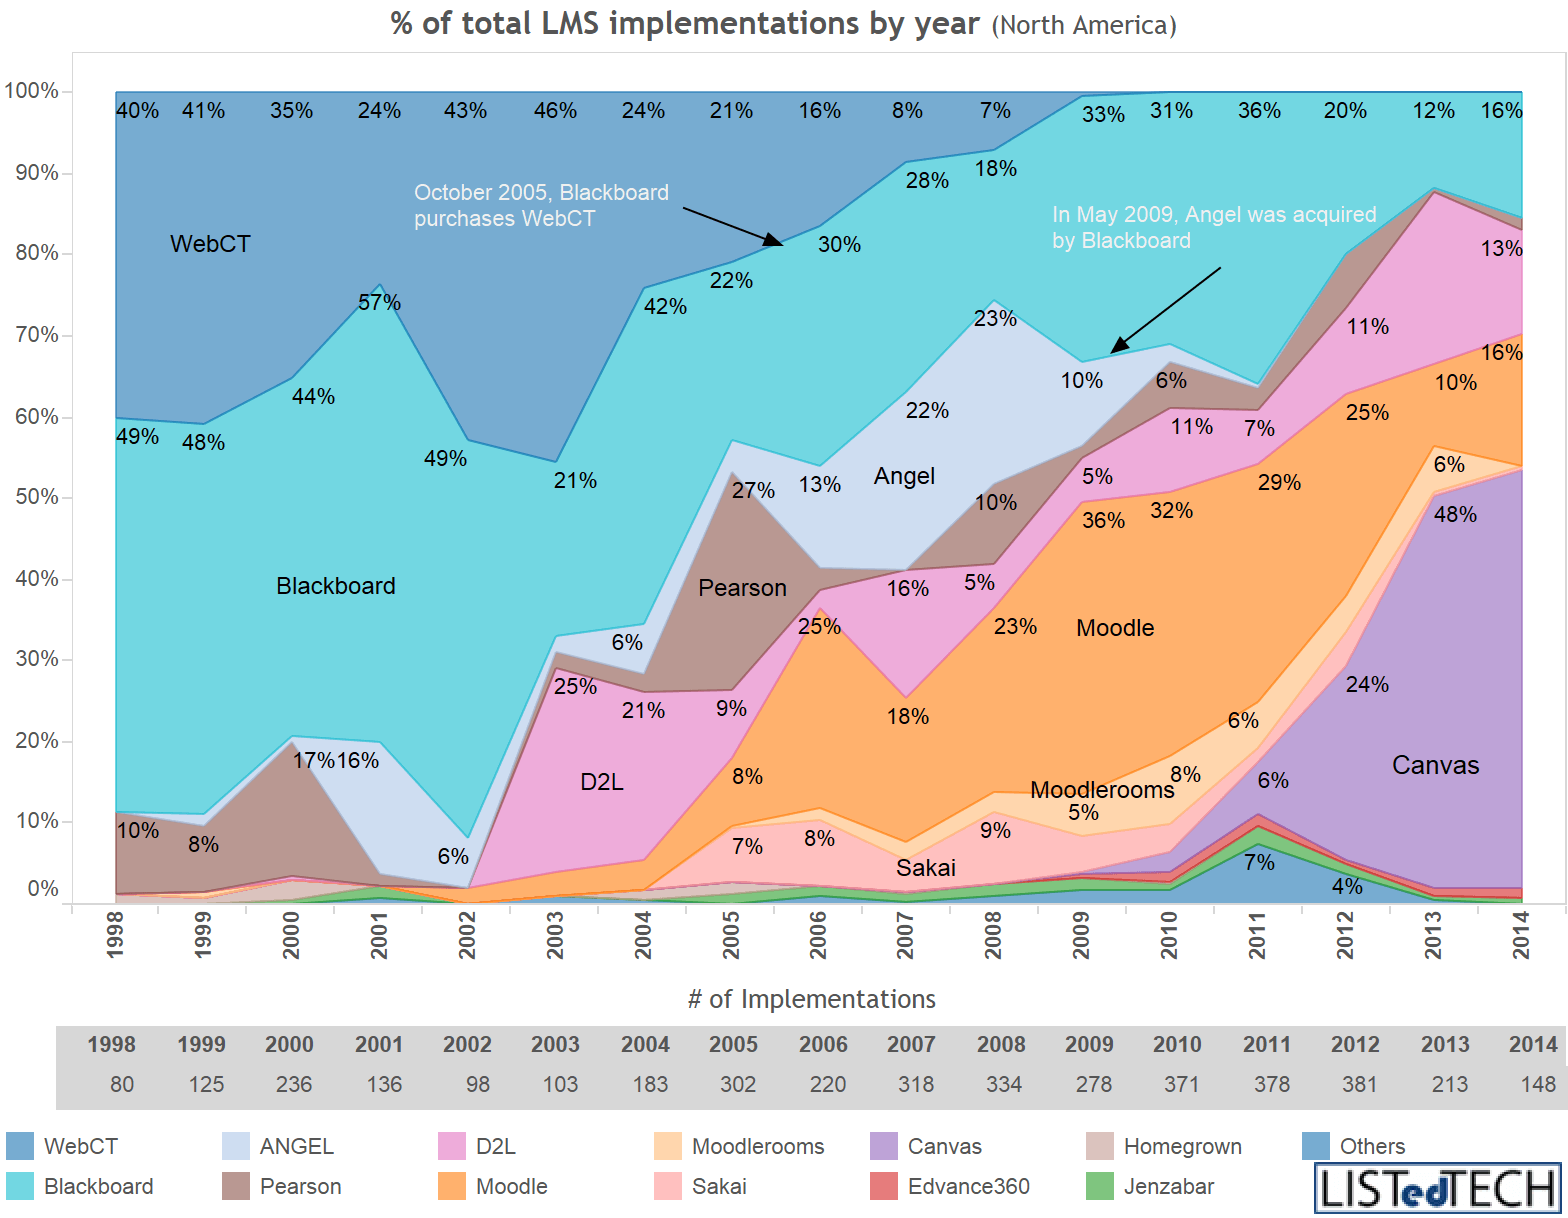
Below is a traditional view of this movement, showing how the North American market morphed between 2009 and 2014.
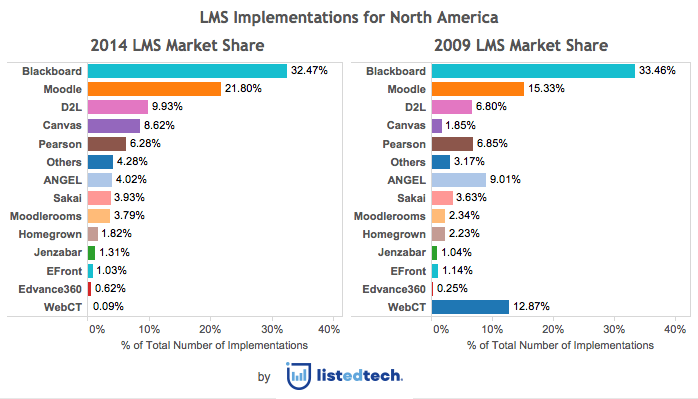
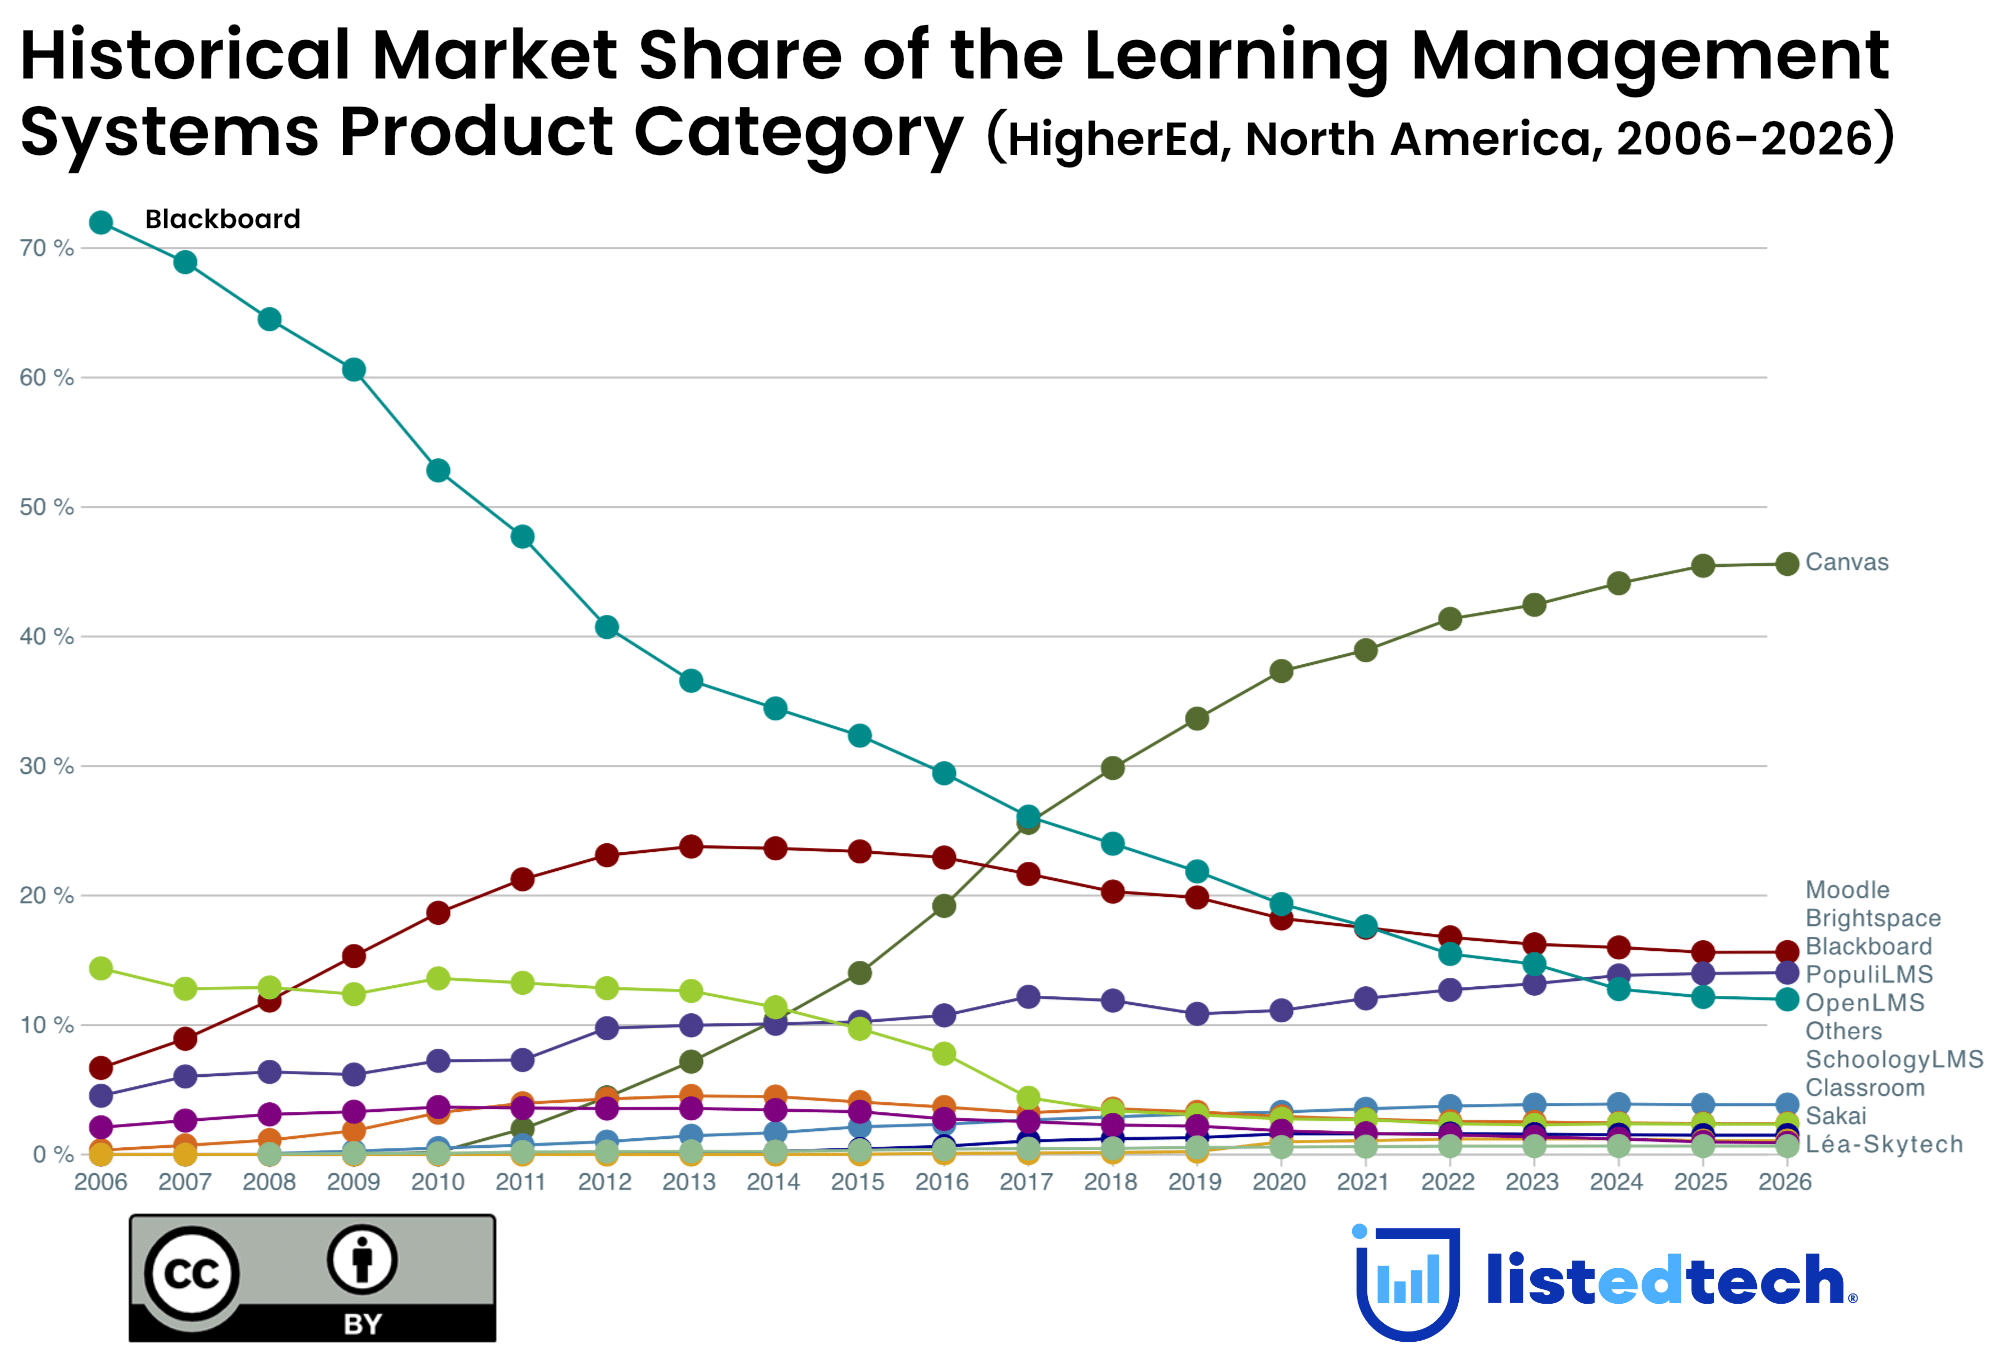
We can see how higher education institutions moved away from WebCT and Angel after they were purchased by Blackboard and, eventually phased out. At the end of 2009, Blackboard (Blackboard + Angel + WebCT) had over 50% of the market. It’s now down to about 30%.
Let’s take a different approach to visualizing how the North American LMS market has evolved throughout the years. Our database contains the “Go Live” dates of over 4,000 implementations. This allows us to see how LMS providers shared the number of new implementations each year. This indicates which products are starting to grab new market shares and which are fading out.
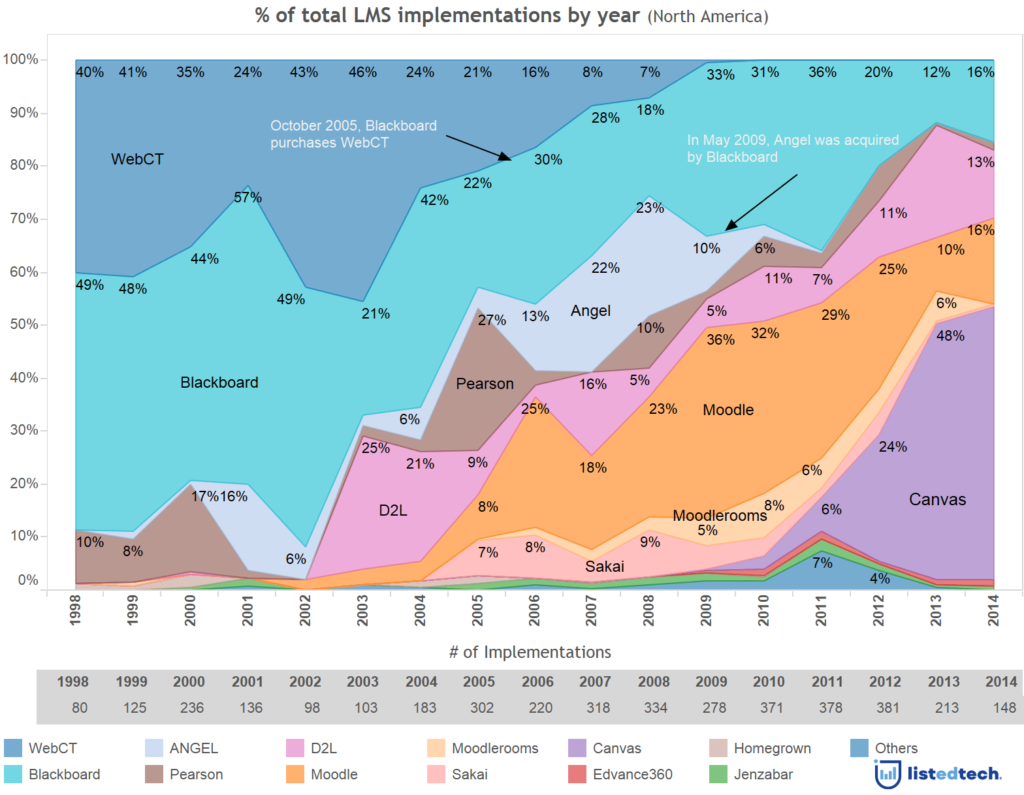
Here are a few observations that we find are worth noting from the above visualization:
Blackboard has clearly lost market shares over the years
Moodle, Blackboard and D2L are now neck-to-neck in terms of market share for 2014
For 2014, Sakai and Pearson are no longer on the short list of possible LMS
Canvas has taken the market by storm and now represents around 50% of all new implementations
Another worthy observation is how the market shifted after WebCT stopped being supported. The number of migrations to other products (not Blackboard) represented about 2/3 of new implementations. Blackboard was only able to keep 30% of the newly “acquired” institutions.
If you would like to see a more detailed view based on a specific sub-market or would like to purchase the underlying dataset, please contact us.
A disclaimer on the visualization above. We try to control for the bias introduced in the way we capture data by validating our results with external sources of data if they exist. But as our data is somewhat novel, we cannot guarantee 100% representativity of the actual market. This also applies to how that market has evolved. We’ve tried controlling for bias by ensuring that all products have between 70% and 80% of the implementations dates of all LMS listings we have in our database. This prevents over-representation of a company based on more successful data capture of a company’s implementation data. But again, our findings can only be partially validated by a third-party source. So, although we try to take the necessary steps to provide our readers with the most representative findings we can extract from our data, the reader should be aware of possible bias introduced in our results.