This post is an update on our Product Implementation Peaks post from January 2021. We can better predict if 2021 will see any spikes in the different product categories with half of the year behind us. Let’s dive in.
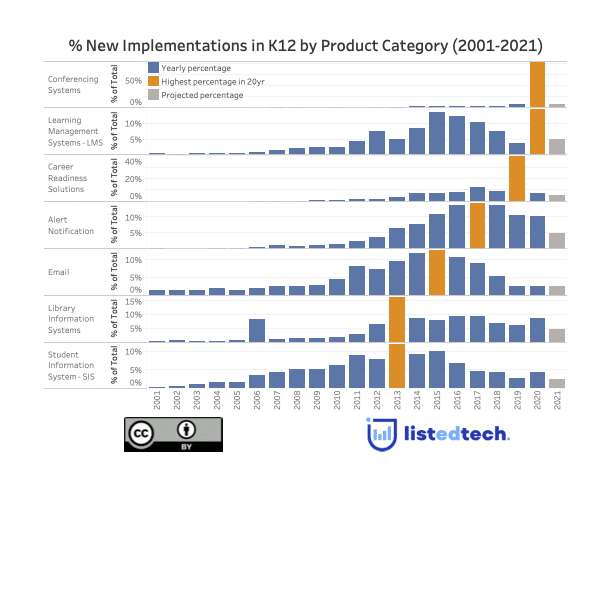
A reminder of what the charts say about implementations: the graphs show the percentage of product implementations in the USA and Canada each year, from 2001 to 2021. To improve the presentation of our data, we include a projection bar (in grey) for 2021, based on the data we added during the first six months of the year. The orange bar represents the year with the highest percentage for each row. By looking at the data this way, we clearly see when a particular system has peaked in implementations within higher education and K-12. Also, by placing the systems’ implementation peaks in reverse chronological order, the graph shows us which product categories are currently the target of massive implementations. For the HigherEd chart, these are Online Program Management, CRM, HR and Finance. For K-12, we see that Alert Notification Systems and, to a lesser extent, Conferencing Systems and Learning Management Systems.
Some products have a few peaks of similar magnitude where implementations seem to follow a cyclical trend. The spikes within these cycles can often be explained by a particular system ceasing to exist (like WebCT in 2011 which describes the LMS implementation peak in 2012). Others have one clear pinnacle that can be interpreted by the enthusiasm of the industry then quickly replaced by another system (i.e. MOOCs which have transitioned into OPMs or again with the email system where, in 2012, institutions migrated to the cloud). The third type of implementation peaks can be explained by external factors which create the need for new software. With the pandemic hitting us hard in March 2020, governments urged institutions to shut down in-person training and teaching, giving educational institutions no choice but to transition to online learning and using conferencing systems.
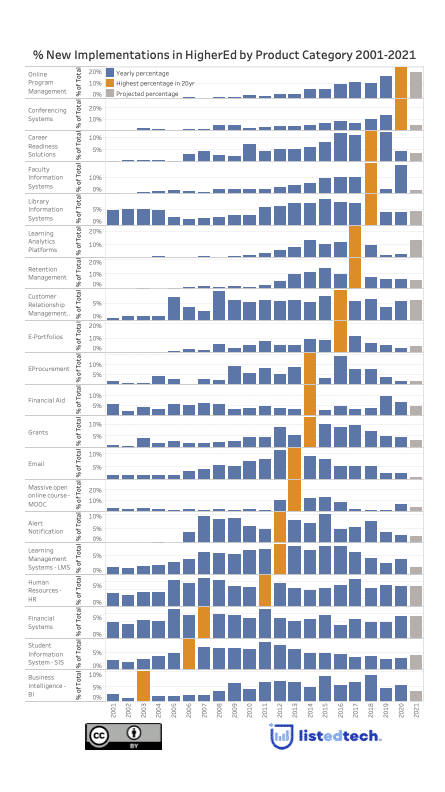
When we look at the HigherEd graph, here are some points to consider:
- Conferencing systems exploded in 2020. In January, we mentioned that this trend would probably continue in 2021. It doesn’t look like it. All institutions that didn’t have a Conferencing System in early 2020 implemented one that year. We assume that the 2021 implementations are mostly scheduled replacements or adjustments.
- Being on an upward trend since 2010, OPM systems are being implemented in considerable numbers in 2020, and this continues in 2021. These implementations help the necessity for brick-and-mortar institutions to diversify their revenues.
- Institutions continue to implement Financial, Human Resources and Student Information Systems, during the pandemic. As we said in the previous posts, these systems are part of the core business of any institution and these implementations take several years to complete.
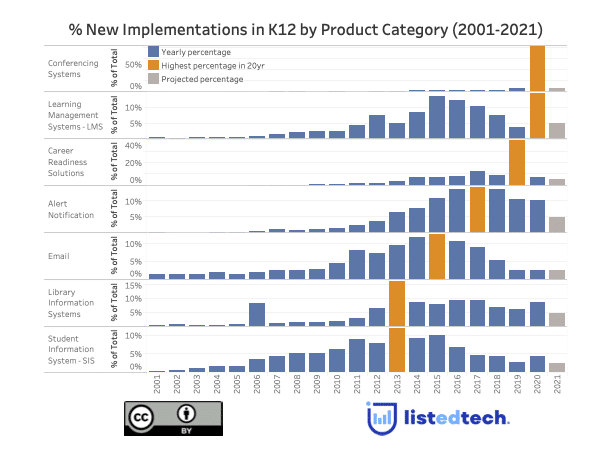
For the K-12 graph:
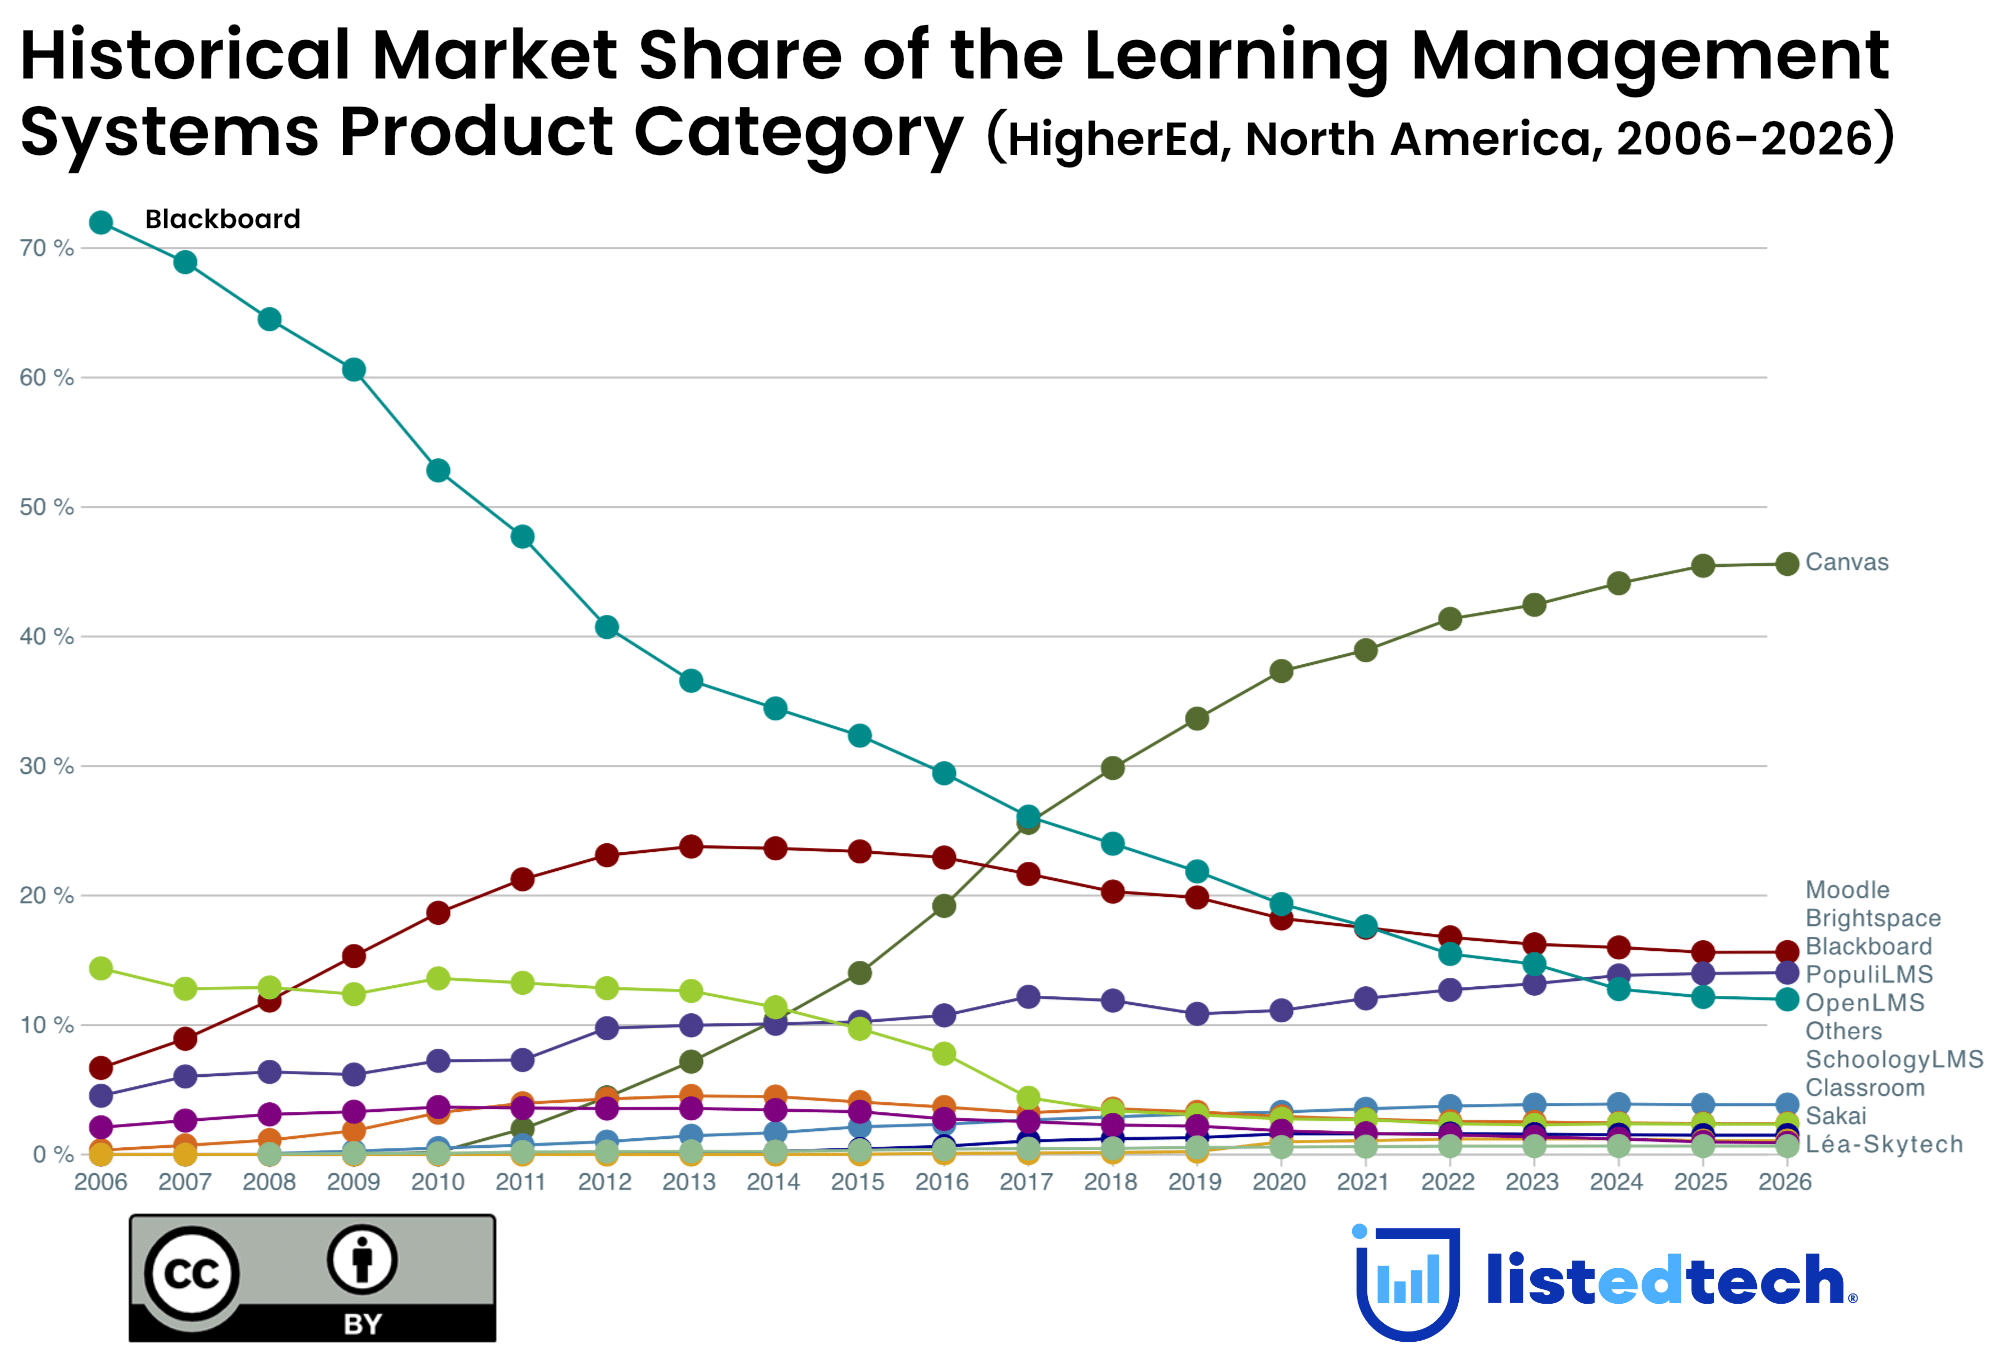
- The LMS product category in K-12 sees a similar pattern compared to the HigherEd chart, except that it is slightly shifted in terms of years (a 2012 peak for HigherEd versus a 2015 peak – pre-COVID – for K-12). It is not expected to skyrocket in 2021 like it did in 2020, but it is looking to be higher than 2019.
- Despite trending downward, Alert Notification Systems represent the biggest potential increase if we compare all K-12 product categories. Since school districts are still juggling between online education and in-school instruction, these systems can help institutions and parents to spread information.
When you look at the two graphs, we need to remind you that not all Y-axes are made equal. Unlike Conferencing Systems (which saw enormous peaks in 2020 for HigherEd and K-12), LMS, SIS, and Email systems don’t have huge peak differences.
Note. All data if for North America.